Strong ceiling for ShibaAccording to the ceiling in front of the price, if the ceiling breaks, it will change the downward trend, and observing the divergence, we can expect the price to return to the floor to try again.
Shibainu

SHIBA: Whale Buy 223 billion SHIB last 24HAccording to a recent report by WhaleStats wallet tracker, a whale ranked 329th on this platform bought slightly over 223 billion Shiba Inu. In the meantime, the lead developer of Shiba Inu has posted a tweet, pushing up the sentiment of the SHIB army regarding Shibarium

Following the rulesWhat do you think this means?
Appendix:
Wave degree:
Primary: Wave 3 (larger degree),
Intermediate: Wave 2,
minor: Wave C,
Structures:
Wave 1 = Impulsive rally,
Wave 2 = Corrective decline,
Wave 3 = Impulsive rally

Comparison charts: $SHIUSDT Shina Inu and $SHIBUSDT Shiba Inu🎀SHI Price Live Data
The live Shina Inu price today is $0.000003 USD with a 24-hour trading volume of $1,090,914 USD. We update our SHI to USD price in real-time. Shina Inu is up 25.23% in the last 24 hours. The current CoinMarketCap ranking is #2761, with a live market cap of not available. The circulating supply is not available and a max. supply of 20,000,000,000,000 SHI coins.
"Shina Inu is a decentralized meme token on the Ethereum blockchain. Its mission is to give back to the crypto community, give to charity, and win the heart of the greatest token of all time, Shiba Inu!
Shina Token is a very fun meme token project that has sold many rare and beautiful NFTs. NFT sales are used to support the team and provide upcoming features such as exclusive access to events and rewards that will soon be announced."

shiba inu USDHi, , if Shiba inu breaks every trend and gives a full back, you can have a 4.5% fall or a 4.5% rise.
Pay attention only when the trend breaks for 1 hour or 15 minutes, when it breaks with a candle for 1 hour or 15 minutes.
Good luck

SHIB: Pullback in UptrendShiba Inu (SHIB) technical analysis:
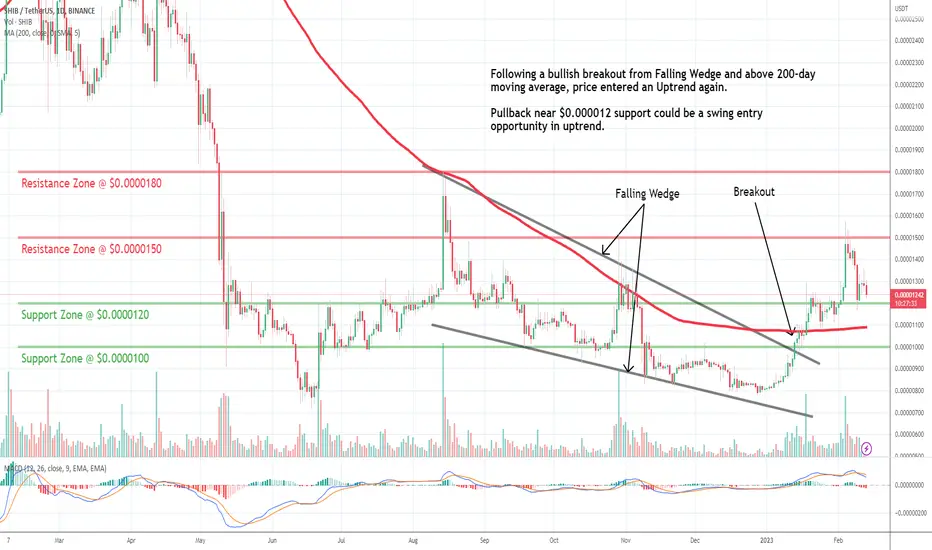
Trade setup : Following a bullish breakout from Falling Wedge and above 200-day moving average, price entered an Uptrend again. Pullback near $0.000012 support could be a swing entry opportunity in uptrend.
Trend : Uptrend across all time horizons (Short- Medium- and Long-Term).
Momentum is Mixed as MACD Line is below MACD Signal Line (Bearish) but RSI > 55 (Bullish).
Support and Resistance : Nearest Support Zone is $0.000012 (previous resistance), then $0.000010. The nearest Resistance Zone is $0.000015, then $0.0000180.

SHIBA after the retest 🚀🚀Hello 🐋
Based on the chart
the price is close to the major support and in the triangle pattern ✔️
and
we expect to see gain and pump from here ✔️
besides
the range market and many range candlesticks are acceptable scenario too 📖💡🚀
👌 Notice: pay attention to the price on shortcut chart (located above the main chart with black colour) 📖💡
Please, feel free to share your point of view, write it in the comments below, thanks 🐋

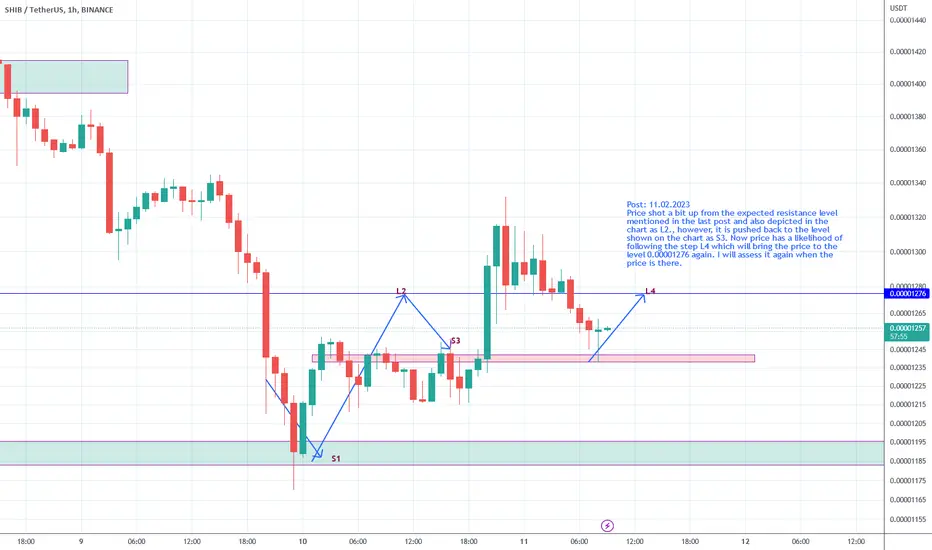
SHIBUSDT heading again for 0.00001276, the 4h resistance levelPrice shot a bit up from the expected resistance level mentioned in the last post and also depicted in the chart as L2., however, it is pushed back to the level shown on the chart as S3. Now price has a likelihood of following the step L4 which will bring the price to the level 0.00001276 again. I will assess it again when the price is there.
SHIBUSDT short term respective the price should retest 0.0114-0.0108 area then looking for pullback.
this is my thoughts and good luck

SHIBUSDT to hit weekly support before a bounceThe price is likely to hit the weekly support level before a bounce. The bounce will very likely meet the 4 resistance area around 0.00001276. The price will be pushed back from this resistance very likely.

Shiba Inu SHIB Price targets if SEC will ban Crypto StakingCoinbase CEO says he heard rumors the SEC wants to ban crypto staking.
Already crypto exchange Kraken shuts down crypto-staking.
This will have ripple effects in the entire industry!
My price targets for Shiba Inu SHIB are:
SHIB/USDT shot
Entry Range: $0.00001200 - 0.00001300
Price Target 1: $0.00001100
Price Target 2: $0.00001000
Price Target 3: $0.00000950
Stop Loss: $0.00001460

SHIBUSDT heading again for 4h resistance zoneThe last post expected to break 4h resistance on the next attempt, however it did bounce from 4h support to 4h resistance, but could not break it and fell back again to the 4h support area. This time again it has found support there.
It is likely that the price will attempt to reach the 4h resistance region again. We evaluate the price action again as soon as the price reaches to the 4h resistance zone. That evaluation will guide the probability of the direction in which price is likely to move.

MdtMdtusdt in binance
Green=Target
Red= Stop loss
Disclaimer
This text is just a personal opinion and should not be used as a basis for decision.

Shiba Inu - Long term bullish but bears currently have controlShib has had a failed breakout and will likely retrace to the 11-12 region over the coming weeks.

SHIBA: BULLISH FLAG PATTERN - LONGBullish Flag Pattern on Shiba Inu coin for a possible Long continuation.
A bull flag is a bullish chart pattern formed by two rallies separated by a brief consolidating retracement period. The flagpole forms on an almost vertical price spike as sellers get blindsided from the buyers, then a pullback that has parallel upper and lower trendlines, which form the flag.

SHIBA INU range and brief gain 📖🚀Hello 🐋
Based on the chart
the price is close to the major support ✔️
and
we expect to see gain and pump from here, besides the range market is acceptable scenario too 📖💡🚀
👌 Notice: pay attention to the price on shortcut chart (located above the main chart with black colour) 📖💡
Please, feel free to share your point of view, write it in the comments below, thanks 🐋


SHIBASHIBA USER STILL HOLD DONT EXIT AND PENIC
according to update
SHIB something You Don’t Want to Miss, Reaper Financial CEO Makes Surprising XRP Prediction, Ancient DOGE Address Wakes Up: Crypto News Digest by U.Today
so wait from downside and get ready for buy from spot

Shib Inu COULD this BE TRap?>? SHIB INU Price Analysis I kinda see a bit of a pattern forming here with SHIB INU on the 4 HOUR ChART .
You can see that we are in an upward wedge here. But at a very critical area of Resistance! COULD this be a Bull Trap ?? I think its possible by the looks of this chart.
So Shib needs to break the .00001212 LVL And then we could see SHIB hit the .00001255 - .00001308 LVL or it will go back and test lower LVLS!
THOSE low areas it might touch could be the .00000989 LVL - .00001047 LVL.
Keep it real out there folks ! :-)

SHIB INU Price Analysis (30 Min Chart)Here's what I'm seeing in today's 30 min chart .
SHIB NEEDS to hold this current area of support around .00001204 IF SHIB Wants to continue on to the upside.If this happens, SHIB will most likely go back up and test the next area of around .00001255 -.00001308. AND then .00001365 LVL will be looking pretty reachable from here.
IF SHIB Cant hold this current Support Zone, we will see the coin drop back down to the .00001140-.00001201 LVLS With LOADS of SUPPORT around the .00000989 - .00001047 LVL .
Thanks for looking!
Have a great day everyone.

SHIBA INU 1 HOUR CHART! SHORT SET UP!!! SHORT IT UPPP !??????? Here's some GOOD KEY LVLS to Keep your EYE on Guys in my personal opinion.

SHIBA INU SHORT!!! PRice ANALYSIS 1 HOUR CHART !!!!!!!HERE WE GO !!
Think we can hit these FIB Targets ??
LET'S GET THIS CRYPTO !!!!
