Bone ShibaSwap ($BONE): Gearing Up for a BreakoutBone ShibaSwap ( TSXV:BONE ) has captured the attention of the crypto community as it gears up for a potential breakout. A vital part of the Shiba Inu ecosystem, TSXV:BONE has emerged as a governance token with unique utility, a growing user base, and a solid infrastructure in the decentralized finance (DeFi) landscape. Here’s an in-depth look into TSXV:BONE , combining technical insights and fundamental analysis.
What Is Bone ShibaSwap (BONE)?
Bone ShibaSwap (BONE) serves as the governance token for the ShibaSwap decentralized exchange (DEX). It allows holders to vote on upcoming proposals, submit new initiatives, and gain access to the ecosystem’s future developments, including NFTs. The token is integral to the Shiba Inu ecosystem, which includes Shiba Inu (SHIB) and Doge Killer (LEASH), and operates on Ethereum.
The ShibaSwap exchange, launched on July 7, 2021, enables users to trade SHIB tokens for other cryptocurrencies. Within this framework, TSXV:BONE acts as a reward and governance tool. SHIB holders can provide liquidity on the platform and stake tokens to earn TSXV:BONE rewards, which are proportional to the staked amount and duration.
Utility and Governance
TSXV:BONE plays a dual role as a utility and governance token. It’s instrumental in enabling the Shiba Army to vote on proposals that shape the ecosystem’s future. With a capped supply of 250 million tokens, TSXV:BONE ensures scarcity while serving as a reward for liquidity providers and stakers.
Market Performance
TSXV:BONE ’s trading volume has seen a 10.90% increase in the last 24 hours, reaching $12,535,369. This uptick indicates heightened market activity and investor interest. It is currently ranked #450 on CoinGecko, with a market capitalization of $170,795,177.
Despite being 95.59% below its all-time high (ATH) of $15.50, recorded on July 7, 2021, TSXV:BONE has shown resilience. Its current price of $0.675 offers a potential entry point for long-term investors. The token’s all-time low of $0.035888, recorded on August 12, 2021, is a stark contrast to its current valuation, representing significant growth.
Ecosystem Integration
BONE’s integration within the Shiba Inu ecosystem as a bridge between SHIB and LEASH enhances its value proposition. The ShibaSwap platform enables users to engage in token swaps, liquidity provision, and staking, further driving the demand for $BONE.
Technical Analysis
As of writing, TSXV:BONE is up 8.24%, reflecting its cooling-off phase following a significant surge in early December. Trading at $0.675, the token is well below its ATH, making it an appealing option for investors looking to capitalize on its recovery potential.
Relative Strength Index (RSI)
The RSI suggests that TSXV:BONE is in a bearish reversal mode, hovering near support levels. This indicates that the token is consolidating after its recent rally, potentially setting the stage for a breakout.
Market Trends
The broader Ethereum ecosystem, of which TSXV:BONE is a part, has outperformed with a 12.70% increase over the past week. However, TSXV:BONE ’s price performance, up 1.20% over the same period, suggests room for growth.
Key Levels
- Support: $0.65
- Resistance: $0.75
A decisive break above the $0.75 resistance level could signal the start of a bullish trend, while a dip below $0.65 might lead to further consolidation.
Opportunities Ahead
1. Increased Adoption: As the Shiba Inu ecosystem expands, TSXV:BONE ’s utility as a governance and reward token is likely to grow.
2. Market Sentiment: The crypto market’s recent bullish sentiment could fuel TSXV:BONE ’s recovery.
3. Community Engagement: The Shiba Army’s active participation in governance could drive TSXV:BONE ’s demand.
Conclusion
Bone ShibaSwap ( TSXV:BONE ) is poised at a crucial juncture. With its robust fundamentals and promising technical setup, the token holds potential for significant upside. Investors should closely monitor market trends and key support/resistance levels to capitalize on TSXV:BONE ’s breakout prospects. As part of the thriving Shiba Inu ecosystem, TSXV:BONE continues to offer a compelling narrative for DeFi enthusiasts and long-term holders.
Shibainu

SHIB | ALTSEASON | Another PUMP for ShibaInu?The reason why I argue that SHIB (and many other alts) are still due for increases , is largely because of two reasons : ETH, and the BTC.D chart.
On the topic of ETH new ATH, more info on that reasoning here:
I've been watching (for months) the interplay between the Bitcoin dominance chart, Bitcoin, and the Total3 chart. There's an interesting hidden pattern that exists here if you overlap them together, giving key insights on the timing of the Bitcoin ATH, and Altseason.
More info on that here:
_____________________
BINANCE:SHIBUSDT BINANCE:ETHUSDT

SHIB is about to explode soon!On the chart we have a big triangle which is a continuing triangle and the wave before this triangle was also bullish.
From where we placed the red arrow on the chart, this triangle has started to form.
Wave D now appears to be ending. Wave D is diametric.
On the green range, wave E can end and then a bullish wave begins.
The target of the move after the triangle can be the break of the ATH
Closing a daily candle below the invalidation level will violate this analysis
For risk management, please don't forget stop loss and capital management
Comment if you have any questions
Thank You

SHIB/USD Trendline BreakoutSHIB/USD is showing signs of a trendline breakout above the resistance level at **0.00003997**. A confirmed breakout and sustained price action above this level could trigger an upward rally.
Entry: Above 0.00003997 in weekly candle
Stop Loss:Place below the breakout candle or trendline (depending on your risk tolerance).
Targets:
First Target (T1):0.00005216
Second Target (T2):0.00006705
Final Target (T3): 0.00008697
Key Notes
- Ensure proper risk management as cryptocurrency markets are volatile.
- Look for volume confirmation to validate the breakout.
- Monitor for potential retests of the breakout level for added entry opportunities.
Would you like any chart or graphical representation of this analysis?

SHIB - Bullish While This Horizontal Is MaintaintedIm quite bullish on alts like shib
I want them to succeed
This horizontal if it doesn't break is a bullish reminder for this coin
Alts are going off soon


Trading opportunity for SHIBUSDTBased on technical factors there is a Buy position in :
📊 SHIBUSDT
🔵 Buy Now
🪫Stop loss 0.00002626
🔋Target 1 0.00004444
🔋Target 2 0.00005555
🔋Target 3 0.00007777
💸RISK : 1%
We hope it is profitable for you ❤️
Please support our activity with your likes👍 and comments📝

Creator of Shiba Inu Launches ShiroThe creator of Shiba Inu is back with Shiro, a new memecoin that's already sparking interest in the crypto community. But is it worth your attention?
Here’s what we know so far:
The project comes from the same team behind Shiba Inu, which adds credibility given their track record.
The official website features thematic episodes exploring recent events in the crypto world, giving the project a unique narrative spin.
There’s speculation that Shiro’s market cap could reach $4-5 billion in the near term, with a potential climb to $10 billion if momentum builds.
Potential or risk?
Shiro has all the hallmarks of a memecoin: the promise of big returns (some are talking about up to 2000% this cycle) but also the inherent risks associated with speculative assets. It could be appealing if you're open to taking a calculated gamble on something new. As always, remember: Do Your Own Research (DYOR) and invest only what you can afford to lose.
The Bottom Line:
For those interested in exploring memecoins, Shiro looks intriguing. You can find it on CoinMarketCap, so check out the official site to learn more and decide if it fits your strategy.
Happy trading and wishing you a great year-end! BINANCE:BTCUSDT COINBASE:ETHUSD BINANCE:SHIBUSDT BINANCE:UNIUSDT

Shiba shortterm movement predictionAs matter of fact i believe Shiba can see higher price even more than beside this believe I also certain about the movement of doge before Shiba - which means At first doge will begin its bullish movement something like XRP and after that the second largest meme coin will begin its upward trend for about one month and will meet its new ATH,
So for first step Shiba needs to has large volume trade above 0.0004 where can see it after 30% gain price price price


Shiba Inu have a tp@ 0.0003$ !!!"As cryptocurrencies continue to rise, Shiba Inu is getting ready for takeoff. The cup pattern on the weekly timeframe, along with the beautiful FTR, indicates that a rise is imminent. The target could easily be between 0.00015 and 0.0003. I hope you have this strange, old, and controversial meme coin in your portfolio."

SHIB Burn Rate Rockets 3,400%, Yet Price Faces Bearish PressuresA Surge in Supply Reduction
The Shiba Inu ecosystem has once again sparked investor interest as its burn rate surged by an astounding 3,400%, reducing the circulating supply by over 2 billion SHIB tokens. This significant burn, executed by key wallet addresses, signals a concerted effort to decrease supply and drive long-term value through scarcity. Over the past week, a total of 4.23 billion SHIB tokens were burned, reflecting a broader trend that aligns with the fundamental law of supply and demand.
Recent large-scale purchases by a major SHIB whale further underscore growing institutional interest, contributing to an optimistic outlook. These strategic burns and acquisitions set the stage for a potentially bullish future as the reduced supply could lead to upward price pressure.
Technical Analysis
Despite the fundamental optimism, Shiba Inu's current price action paints a mixed picture. At the time of writing, CRYPTOCAP:SHIB is down 6%, trading around $0.00002813. It recently formed a bearish pattern, but crucially, the daily chart reveals a developing bullish flag—a pattern that often precedes significant upward breakouts.
The Relative Strength Index (RSI) stands at 51, indicating neutral momentum. This provides ample room for CRYPTOCAP:SHIB to break the current wedge pattern and push higher, should buying pressure intensify. The coin's monthly gain of 70% suggests that the recent dip could be a temporary consolidation before another upward thrust.
What’s Next for CRYPTOCAP:SHIB ?
Shiba Inu's combination of strong community support, a rising burn rate, and significant whale activity lays a robust foundation for future growth. While the current dip reflects short-term market corrections, the underlying fundamentals suggest that CRYPTOCAP:SHIB could be preparing for a breakout. We predict a doubling in price if the bullish flag pattern holds and the burn rate continues to impact supply.
Investors should watch key support levels around the 38.2 % Fibonacci retracement, as any sustained move above this level could signal a new bullish phase.
Conclusion:
Shiba Inu's recent burn rate surge is more than just a statistical anomaly—it’s a signal of strong community-driven efforts to reduce supply and enhance value. Combined with its growing ecosystem and solid technical setup, CRYPTOCAP:SHIB may soon reward patient holders. The question isn’t if Shiba Inu will rebound; it's when.

Shiba inuShib usdt daily analysis
Time frame 4 hours
Risk rewards ratio >4 👈👌
Support line is very close and it's good for my trade
👇👇
If price break Support line strongly, maybe Shiba needs to rest and reserve and pump up quick and fast

Shiba inuShib usdt Daily analysis
Time frame 4 hours
Risk rewards ratio >2 👈👌
When I watch Shiba usdt chart I see 2 rectangle that price move up and down in it.
When Shiba broke the rectangle I see the pump of price.
Therefore I guess when Shiba break again , we will have a good pump

SHIBA INU more gain is comingHello and greetings to all the crypto enthusiasts, ✌
In several of my previous analyses, I have accurately identified and hit all of the gain targets. In this analysis, I aim to provide you with a comprehensive overview of the future price potential for SHIBA, 📚💡
As observed, a substantial influx of trading volume has entered the market for this asset, further bolstered by strong backing from one of the largest media platforms and communities within the global cryptocurrency space, which enhances its influence and market visibility. 📚
Despite the current bullish momentum, there remains the possibility of a price pullback toward the next lower Fibonacci support level. 📚✌
However, after this potential dip, we anticipate a rebound and renewed upward movement, leading to a recovery and a subsequent price increase. 🎇💡
🧨 Our team's main opinion is A strong influx of trading volume, backed by major media support, suggests potential short-term pullbacks to lower Fibonacci levels, followed by a recovery and further price growth. 🧨
Thank you for your attention. If you have any questions or comments, I’m here to respond to you. 🐋💡

SHIB Bullrun Target $0.0003 (10x)Shiba is trending well. Had a Golden cross in April and MACD cross in September. Higher lows on the weekly. Bounced off the 100 Week Moving Average in September.

BTC/USD : More Bullish Move Ahead? (READ THE CAPTION)Analyzing the #Bitcoin chart on the weekly timeframe , we observe that over the past week, Bitcoin experienced a correction after its rise to $99,588, pulling back by 8% and reaching $90,700. However, in the last two days, Bitcoin has shown renewed demand and has managed to climb back to the $98,000 level.
The big question now is whether Bitcoin can finally hit the key $100,000 target within the next two days. If this crucial level is broken, we are likely to witness an initial wave of selling pressure, followed by a potential continuation toward higher targets. The next probable levels to watch for are $111,000, $122,000, $129,000, and $139,500 .
This analysis will be updated as price action unfolds. Stay tuned! 🚀
Please support me with your likes and comments to motivate me to share more analysis with you and share your opinion about the possible trend of this chart with me !
Best Regards , Arman Shaban

The Resilience of Kabosu (KABOSU): A Tale of Meme PotentialIn the ever-volatile world of cryptocurrencies, few tokens manage to capture the essence of community spirit and cultural phenomenon as vividly as Kabosu ($KABOSU). Named after the Shiba Inu dog that became the face of Dogecoin, Kabosu embodies more than just a meme; it's a symbol of resilience, community, and charity. This article delves into the recent market performance of KABOSU, highlighting both its technical chart patterns and its fundamental values that could drive its potential recovery and growth.
Technical Analysis:
Currently, Kabosu (KABOSU) has been trading within a falling wedge pattern for over two weeks. This pattern, characterized by a series of lower highs and lower lows, often signals a potential reversal. For Kabosu, this could mean it's gearing up for a significant bounce back. The narrowing of the wedge suggests that the selling pressure is diminishing, and a breakout could be imminent, potentially leading to a return to previous highs.
With an RSI hovering around 51, Kabosu shows a neutral stance, neither overbought nor oversold. This equilibrium in the RSI indicates that the token might be ready for a move if triggered by external factors like market sentiment or broader crypto trends.
Despite the optimistic wedge pattern, the presence of a death cross—where a short-term moving average crosses below a long-term moving average—signals caution. Historically, this pattern suggests bearish momentum, but in the crypto market, such signals can sometimes precede a contrarian move upwards, especially if accompanied by positive developments or shifts in investor sentiment.
The performance of Kabosu is not isolated. Given its meme coin status, it's heavily influenced by movements in Bitcoin ( CRYPTOCAP:BTC ) and the overall meme coin sector. The holiday season, including events like Thanksgiving, can often inject unpredictability into market movements, potentially offering a window for turnaround.
Beyond the Charts
Kabosu isn't just another cryptocurrency; it's a movement with a heart. Dedicated to the memory and spirit of Kabosu, the Shiba Inu dog, the token represents kindness, community support, and charity. This narrative adds a layer of intrinsic value, appealing to investors who value more than just financial returns.
Charitable Endeavors: The project's focus on supporting animal shelters resonates with a broad audience, potentially attracting investors who are looking to contribute to a cause while participating in the crypto economy. This unique selling proposition could drive demand, especially if the community grows or high-profile partnerships are announced.
Zero Tax Policy: The recent adjustment to a 0% tax on buys and sells simplifies the trading process for holders, removing the friction of transaction fees which might encourage more trading volume and liquidity.
Decentralized Commitment: The renounced contract and locked supply are strong signals of commitment to decentralization and scarcity, respectively. These actions can build investor confidence by ensuring that no additional tokens can be minted, theoretically increasing value as demand grows.
Conclusion
Kabosu ($KABOSU) stands at a crossroads where technical patterns suggest potential for recovery, while its fundamental ethos offers a compelling reason for long-term holding. The interplay between its chart patterns and its community-driven mission might just be the catalyst needed for a rebound. However, investors should remain cautious; the crypto market is notoriously unpredictable, and external factors like regulatory news or shifts in the broader market sentiment can significantly impact performance.

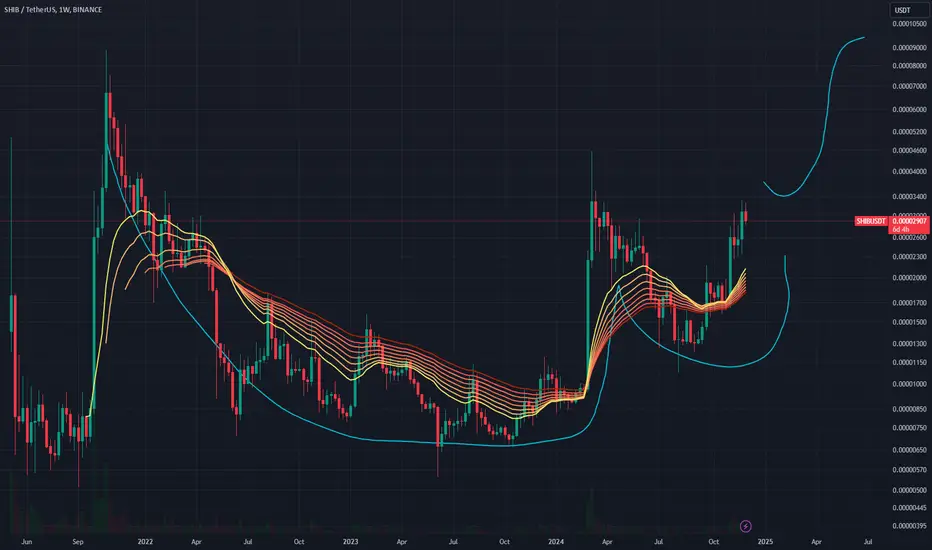
SHIBUSD: Expecting a massive pump soon.Shiba Inu just turned bullish on its 1D technical outlook (RSI = 59.750, MACD = 0.000, ADX = 25.625) but practically remains ranged inside a Bull Flag. As long as the 1D MA200 supports though, the trend will be bullish, coming off the HL Zone and a 1D Golden Cross. The Golden Cross before that (December 1st 2023) led to a similar Bull Flag, which after testing and holding the 1D MA200, it broke upwards aggressively to a +575% rise. We expect a similar outcome (TP = 0.000073).
## If you like our free content follow our profile to get more daily ideas. ##
## Comments and likes are greatly appreciated. ##

If you're a DOGE guy, this is your chance If you're a DOGE/Elon guy thinking this rip, this is a good spot to take a long

SHIBUSDT LongWe see potential consolidation on the SHIB H4 chart. The support zone has been retested, and now it’s time to retest the resistance level at 0.028. Potential uptrend of +18%. Good luck!

#SHIB 1H. Rising triangle and speculation. 11/22/24
The price has formed an ascending triangle pattern, managed to reach the support level (duringa local correction), and quickly bounced back. Considering these and other factors, I’m looking at this as a potential opportunity for speculation, anticipating further upward movement.
As for you, I recommend entering a position at your own discretion—the decision is yours!
The extreme target is $0.00003042
