SHIBA - Ready to MoonShiba has been under-performing compared to other meme coins however it is nearing a break of trendline and this should open higher levels. As far as lower levels hold, we should see a agressive Bullish Move.
For entries, please wait for at least two candle reversals at the specified level and apply appropriate risk management.
If you found this analysis helpful, please consider boosting and following for more updates.
Disclaimer: This content is for educational purposes only and should not be considered financial advice.
Reversal in Price Expected
Shibainu

SHIBUSDT Up Trend ContinuationSHIBUSDT recently surged after breaking out from a consolidation zone, reaching the resistance area at 0.00003 before pulling back. Currently, the price is moving sideways, forming a range as it approaches the upward trendline. This narrowing price action may lead to a breakout and potentially another price surge. The market may dip below the previous week's low to take liquidity before moving higher. The target is the resistance zone around 0.00003

SHIB buy/long setupAn important trigger line has been broken on the chart. I have a bullish iCH chart. The larger structure is bullish.
We should look for buy/long in the support ranges.
We are looking for buy/long in the specified range of demand.
Closing a daily candle below the invalidation level will violate this analysis
Do not enter the position without capital management and stop setting
Comment if you have any questions
thank you

SHIB looks bullish (1D)SHIB seems to be bullish. From where we put the red arrow on the chart, it looks like a triangle is formed, and we are now in wave E of this triangle.
By hitting the green range, we expect another pump from SHIB.
The targets are marked on the picture.
Closing a daily candle below the invalidation level will violate this analysis.
For risk management, please don't forget stop loss and capital management
When we reach the first target, save some profit and then change the stop to entry
Comment if you have any questions
Thank You

“The Shift Is Coming: Bitcoin’s Decline in Dominance and the RisThe cryptocurrency market is evolving. For years, Bitcoin has been the undisputed leader, dictating the rhythm of bull and bear markets. But if you’ve been paying attention, subtle shifts are already underway, hinting at what the future holds.
As Bitcoin falls, certain altcoins are rising. This is more than just a temporary trend—it’s a small-scale preview of what’s coming on a much larger scale.
The Decline of Bitcoin Dominance
Bitcoin’s dominance over the crypto market has been its defining feature, but year by year, that dominance is shrinking. The days when Bitcoin single-handedly led every bull run may be nearing an end.
Innovative altcoins with real-world utility, scalability, and vibrant ecosystems are carving out their own paths. From Ethereum’s smart contract dominance to projects like Solana, Polygon, and even meme coins, the market is becoming more decentralized—not just in technology but in leadership.
Bitcoin will always be “digital gold,” but that narrative alone may not be enough to sustain its lead. As altcoins continue to innovate, attract attention, and grow communities, Bitcoin’s role as the crypto market’s “North Star” could wane.
The Rise of Altcoin-Led Bull Runs
The 2021 bull run introduced sectors like DeFi, NFTs, and play-to-earn gaming, showing that narratives beyond Bitcoin can drive capital into crypto. Now, we’re seeing specific coins decouple from Bitcoin’s movements. This decoupling is just the beginning.
Future bull runs could be triggered not by Bitcoin but by:
• New Technology: Layer 2 solutions, zero-knowledge proofs, and faster blockchains.
• Sector-Specific Booms: DeFi 2.0, AI-integrated cryptos, or Web3 applications.
• Community Movements: Meme coins like Dogecoin and Shiba Inu that thrive on viral momentum.
Altcoin-led rallies will redefine how we perceive market cycles. Bitcoin might still play a role, but it won’t always lead the charge.
Money Flowing from Equities to Crypto
Here’s another macro trend to watch: More money is leaving the traditional equities market and moving into crypto. Why? The returns in crypto are astronomical compared to stocks.
Retail traders are already driving this shift, lured by the potential of 10x and even 100x gains. But it won’t stop there. As crypto becomes more accessible and regulated, banks and institutional investors will dive in deeper.
The Inevitable Institutional Rush
Imagine a world where banks are buying meme coins. Sounds absurd? It’s closer than you think.
Meme coins have already made their way into mainstream financial platforms. Dogecoin and Shiba Inu are listed on major exchanges, used for payments, and even supported by celebrity endorsements. Institutions, once dismissive, are now taking notice.
When retail traders prove a narrative works, institutions follow. First, it will be Bitcoin and Ethereum. Then, it will be DeFi protocols. Finally, meme coins could become speculative assets in institutional portfolios.
What This Means for You
The crypto market is maturing. Bitcoin will always have a role, but it’s no longer the only player in the game. The future is multi-faceted, decentralized, and packed with opportunities across a range of altcoins.
As a trader, staying ahead means:
1. Tracking Narratives: What sectors are gaining traction? DeFi, gaming, AI, and meme coins could lead the next cycle.
2. Diversifying: Don’t put all your capital into Bitcoin. Explore altcoins with strong fundamentals and active communities.
3. Preparing for Institutional Influx: Follow the money. Where retail traders go, institutions eventually follow.
The shift is coming. Are you ready for a market where Bitcoin no longer dominates?
If you agree, hit that like button, share this with your community, and let’s talk about the future of crypto below!

#SHIB/USDT#SHIB
The price is moving in a bearish channel on a 4-hour frame and is adhering to it to a large extent
The price rebounded well from the green support area at the support level 0.000022000, which is a strong level.
We have a trend to hold above the Moving Average 100, which is strong support for the rise
We have very strong oversold resistance on the RSI indicator to support the rise, with a downtrend about to break higher
Entry price is 0.00002350
The first goal is 00.00002570
The second goal is 0.00002700
The third goal is 0.00002900

SHIBUSDT Price Breaks Flag Pattern!SHIBUSDT has broken out of a bullish flag pattern on the 1H chart and is trading above the 100 and 200 EMAs. The price surged by 60% after breaking through the resistance zone and has been forming a bullish flag pattern over the last 5 days. Today, the price broke through the flag's resistance, and after a minor pullback, a significant bullish move is expected.

SasanSeifi| Will the Uptrend Continue? Key Levels to Watch!
👇previous analyses
Hey there, ✌ Based on previous analyses, the price encountered significant demand around the 0.000013 range. With a strong momentum breakout through the supply zone and surpassing the 200-period moving average, the price successfully reached the second scenario target of 0.000020, showing an impressive growth of approximately 50%. However, without confirming a stable position above the 0.000020 level, the price retraced as outlined in the projected scenario.
It was noted that the price reacted to the EMA, highlighting the 0.000015 level as a crucial support zone. If this support holds and confirmation is achieved in lower timeframes, the price could once again rise towards the 0.000020 range and even higher targets.
As observed, the price was met with renewed demand after maintaining the specified support zone and surged toward the 0.000023 – 0.000025 target range and the 0.000030 level, achieving an additional 83% growth.
👇NEW analyses
Currently, after this rally from the 0.000030 level, a negative reaction has caused a pullback toward the 0.000022 area. The outlook leans bullish. The scenario to consider is that, with the 0.000021 level holding and confirmations in lower timeframes, the completion of the pullback could lead the price to a long-term target at 0.000032 and a liquidity zone around 0.000038. Maintaining the critical levels of 0.000021 – 0.000020 is essential.
💢 Please remember that this is just my personal viewpoint and should not be taken as investment advice. I’d love to hear your thoughts and share opinions!
Happy trading!✌😎
Sure, if you have any more questions or need further clarification, feel free to ask. I'm here to help!✌

DOGE vs SHIB | UPSIDE POTENTIAL | Which is Better for ALTSEASON?DOGE and SHIB have one thing in common : both are meme coins - and that is probably the only thing.
They each take turns to pump and dump, based on their position in the Total Cryptocurrency by Market Cap Rank. One of these, stands to gain much more than the other due to a few reasons as pointed out in the analysis.
Which one are you rooting for this altseason?
Speaking of altseason; don't miss yesterday's important update on BTC, Bitcoin Dominance, TOTAL3 and altseason:
_________________________
BINANCE:DOGEUSDT BINANCE:SHIBUSDT

SHIBA INU more gainHello and greetings to all the crypto enthusiasts, ✌
In several of my previous analyses, I have accurately identified and hit all of the gain targets. In this analysis, I aim to provide you with a comprehensive overview of the future price potential for SHIBA INU, 📚💣
As observed, a significant influx of trading volume has entered the market for this asset. Moreover, this asset is backed by one of the largest media platforms and communities in the global cryptocurrency space, enhancing its influence and market visibility. 📚🎇
Despite the current momentum, there is a possibility of the price declining further to the next lower Fibonacci support level.📚✌
However, following this potential dip, we anticipate a renewed upward movement, leading to a recovery and subsequent price increase. 🎇💡
🧨 Our team's main opinion is Significant trading volume has entered this asset, supported by one of the largest crypto media communities. The price may dip to a lower Fibonacci level before likely rebounding. 🧨
Thank you for your attention. If you have any questions or comments, I’m here to respond to you. 🐋💡

SHIB USDT updateThe analysis is in daily time form, so it takes a little time.
Based on the base that was formed below, I sent my analysis, which fortunately was flawless
I checked it more closely today, not much has changed, but I sorted it out and with more precise targets
Friends, there is no doubt that Shiba is bullish, but it is necessary for this trend to close above 30 candles with a strong body and turn this range from 27 to 29.5 into a strong support.
So, in my opinion, it is still too early to say that his promotion is certain
Wait for it to come above this range, close the candle and then safe entry for those who are still waiting for the opportunity to buy.
Shiba's support:
0.00002628
0.00002450
0.00002313
Shiba resistors:
0.00002958
0.00003300
0.00003915
Shiba targets:
near:
0.00004699
0.00006942
Round:
0.000105
0.0001412
0.0001644

Next leg up coming soon! She can’t wait to fly! Not financial advice ! Just hold for the ride! Shiba Inu is primed after
bitcoin’s monstrous growth! And dogecoin following suit. Elon x Trump conversion.

SHIBA INUAlready the downtrend started in March
0.000020 Resistance breakout can led to the 0.000040

Analyzing the Impacts of Shiba Inu's Ambitious US Hub Plan
Shiba Inu's Bold Vision for a US Blockchain Hub
Shiba Inu, the popular meme coin, has recently made headlines with its ambitious plan to establish a strategic blockchain innovation hub in the United States. This bold move, proposed by lead developer Shytoshi Kusama, has sent ripples through the crypto community, leading to a significant 23% surge in the price of SHIB.
A Silicon Valley for Crypto
Kusama's vision is to create a "Silicon Valley for crypto" within the US, fostering innovation, job creation, and economic growth. The proposed hub aims to attract top talent, startups, and investors to the United States, solidifying its position as a global leader in blockchain technology.
The proposed hub, dubbed S.H.I.B., is estimated to cost several billion dollars over a 5-10 year period. However, Kusama believes the long-term benefits far outweigh the initial investment. The hub is expected to generate significant economic activity, create thousands of jobs, and attract numerous blockchain projects to the United States.
Key Components of the S.H.I.B. Plan
• Infrastructure Development: The hub will invest in state-of-the-art infrastructure, including high-speed internet, data centers, and research facilities.
• Economic Incentives: The plan includes tax breaks, grants, and other incentives to attract businesses and talent to the hub.
• Talent Development: The hub will focus on education and training programs to develop a skilled workforce in blockchain technology.
• Regulatory Framework: The hub will work closely with regulators to create a clear and supportive regulatory environment for blockchain businesses.
• Sustainable Practices: The hub will prioritize sustainability, incorporating green energy solutions and eco-friendly practices.
The Impact on SHIB
The announcement of the S.H.I.B. plan has had a significant impact on the price of SHIB. The cryptocurrency has experienced a 23% surge in value, reflecting investor enthusiasm for the project. This surge highlights the potential of the Shiba Inu ecosystem and its ability to drive innovation and growth in the blockchain industry.
The Broader Implications
Shiba Inu's ambitious plan is not only significant for the cryptocurrency but also for the United States as a whole. By attracting top talent and fostering innovation, the hub could help the US maintain its competitive edge in the global technology race.
Moreover, the S.H.I.B. initiative could have a positive impact on the broader cryptocurrency industry. By creating a supportive ecosystem for blockchain businesses, the hub could accelerate the development of new technologies and applications.
Conclusion
Shiba Inu's proposal for a strategic blockchain innovation hub in the United States is a bold and ambitious endeavor. If successful, the hub could transform the US into a global leader in blockchain technology, creating significant economic and social benefits. The 23% surge in SHIB price reflects the market's optimism for the project and its potential to drive future growth.

SHIB IS PRIMED FOR A MASSIVE 123% MOVE HIGHERCRYPTOCAP:SHIB
SHIB IS BREAKING OUT AND IT'S A BUY RIGHT NOW!
ITS A #HIGHFIVESETUP MEANING THE FOLLOWING:
1.) BULLISH uptrend on MACD (blue over orange
2.) BULLISH uptrend on RSI (higher lows)
3.) BULLISH uptrend on Stoch (red over yellow)
4.) We have a volume shelf with a volume gap
5.) Breakout on the symmetrical triangle pattern
Price Targets for this Weekly chart:
PT1: 0.000029584
PT2: 0.000044097

SHIBUSDT Bullish Move Confirmed!SHIBUSDT technical analysis update
SHIB's price has broken the trend resistance line and made a new higher high on the daily chart. Additionally, it has crossed above the 100 EMA on the daily timeframe, which is considered a strong bullish signal for SHIB.
We could potentially see a 100-200% bullish move in SHIB over the next few months.

Shiba Inu breaking upward from channel; over halfway to targetSheba is blasting off so quick by the time I got around to posting a chart about it t’s already 3/4ths of the way to the breakout target. *not financial advice*

SHIB/USDT: Bullish Inverse Head and Shoulders Pattern Breakouthello guys.
Pattern Formation: The inverse head and shoulders pattern, with a well-defined neckline, indicates a bullish reversal signal.
Breakout Confirmation: Price has broken above the neckline, a key resistance level, which suggests a continuation toward higher targets.
Price Targets: If the bullish momentum holds, the next major resistance is around $0.00003700, with the potential to reach $0.00005700.
Risk: Failure to maintain above the neckline could result in a pullback, potentially re-testing lower levels before any further bullish movement.

Shiba Inu (SHIB)Shiba needs no introduction, a so-called quick-become millionaire meme coin that many still believe in. Anyway, SHIB has been oscillating in a sideway channel. Currently, price is at the bottom of this channel and posed to break the minor downtrend line. Let's see what happens.

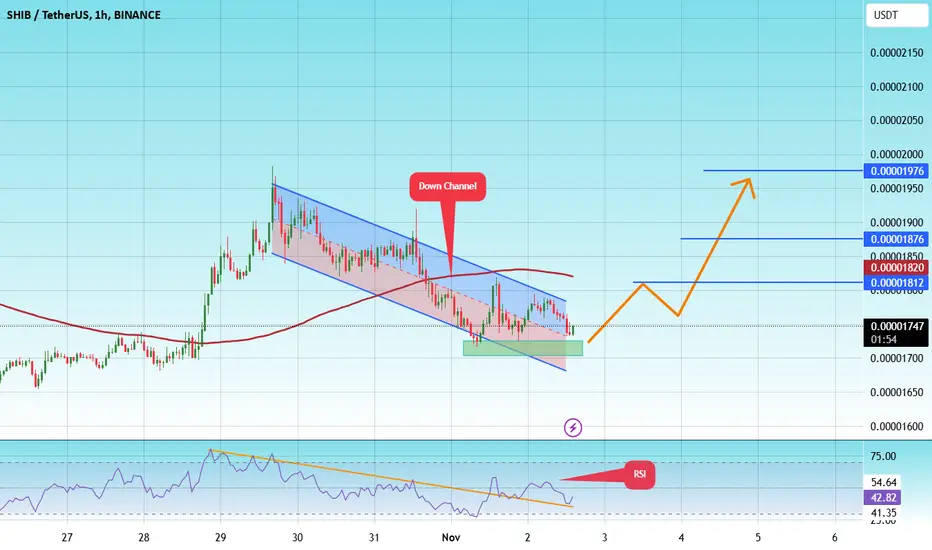
#SHIB/USDT#SHIB
The price is moving in a descending channel on the 1-hour frame upwards and is expected to continue.
We have a trend to stabilize above the moving average 100 again.
We have a downtrend on the RSI indicator that supports the rise by breaking it upwards.
We have a support area at the lower limit of the channel at a price of
0.00001721
Entry price 0.00001742
First target 0.00001812
Second target 0.00001876
Third target 0.00001976
Are you ready ???? #SHIBA#shiba is ready for takeof
The time has come for Shiba to start its flight, after the explosive price of Dogecoin, now it is Shiba's turn to change the trend and become bullish by breaking the downward trend line.

SHIB Looks BullishShiba appears to be entering a bullish wave C.
By maintaining the green range that overlaps with the KEY level, it can go to the ATH.
You should not have an emotional entry, you must have a set position to enter.
Shiba's market cap is 13B, which is a bit heavy, and you shouldn't expect big profits from this coin.
The target is above ATH
Closing a daily candle below the invalidation level will violate this analysis
For risk management, please don't forget stop loss and capital management
When we reach the first target, save some profit and then change the stop to entry
Comment if you have any questions
Thank You

SHIBA USDT DAILY According to the range specified in the specified box, good targets can be predicted for the short term. The targets are specified
