Shiba INU Last Round? Nov 10On Sunday, Nov. 7, a block registered on Etherscan shows a single transaction for 20,000,000,000,000 Shiba INU tokens for more that $1.13 billion U.S. The purchase originated at crypto.com
Wait for the triangle to break from above if you want to buy.
There aren't much information about SHIBUSDT
Shibarmy

Hang in there people, its all going to planShiba still following previous pattern very closely. RSI and MACD are even a little lower than they were in the previous rally, which means there is could be more room to grow. Volume still higher and AMC theatre is still talking about accepting Shiba as payment. Like the kids say, Diamond Hands.

SHIBA silence and stabilityshiba is very calm at the moment, we don't see much impact of btc on shiba growth, shiba is going its own way, but that's good, because with a potential correction in btc, shiba will be calm

ShibaInu Meme Token FUD/DOGE KillerOpportunity is Avaible to those who have their eyes open... Seems no matter the media trys they will not succeed in bringing in a Bearish movement for long.


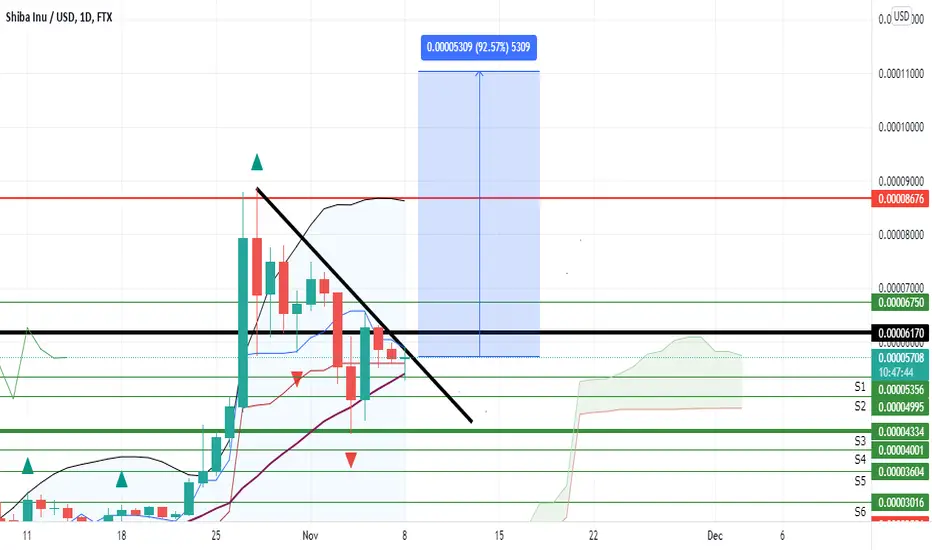
SHIBA INU - 100%+ possible move comingShiba Inu (SHIB) is hovering right below the breakout trendline inside a huge rising broadening wedge pattern.
A few other things to note:
1) RSI is ready for the next leg up
2) Volume seems to be declining (getting ready for a move)
3) Bollinger Bands are tightening. See circled example.
We could be seeing over a 100% move as shown in the chart back to the top of the wedge pattern.
What are your thoughts? Comment below, hit the like and follow me. Thank you!
Disclosure: This is just my opinion and not any type of financial advice. I enjoy charting and discussing technical analysis . Don't trade based on my advice. Do your own research! #cryptopickk #bitcoin #altcoins

SHIBA INU is forming flag expecting breakout soon!!TECHNICAL ANALYSIS: #SHIBAINU (4hrs update)
In 4hr timeframe, Shib has Been in Bullish Trend & at the Moment, Consolidating in Flag from local top.
#shiba is Forming Bullish Flag Which is a Continuation Pattern So In Case of Breakout, Expecting Another +50% Bullish Wave ahead (Maybe in mid November)
Expecting More Consolidation so SHIBA Might retest the 0.00003955-0.00003656k Area Before Final Bullish Wave.
🥰If you find this helpful and want more FREE forecasts in Tradingview😍.
Please show your support back🙏,
Hit the 👍 LIKE button,
Drop some feedback below in the comment✍️!
❤️🤝 Your Support is very much 🙏 appreciated!❤️🤝
💎 Want me to help you become a better Crypto trader?
Now, It's your turn!
Be sure to leave a comment; let me know how you see this opportunity and forecast.
Trade well, 💪
#SHIBCOIN #CRYPTO #BULLISHRUN #ALTCOIN #UPTREN #SHIBARMY

SHIB is in supportCurrently SHIB is in a support zone I would suggest keeping an eye on this as we can potentially see this consolidate within the green box here.
We may also see this fall to the next green box however I would recommend buying in between the two boxes to get a great averarge entry! We can expect this to lose another 0 before 2022 but I just wanted to show the best entries!

SHIBA INU ASCENDING TRIANGLE PATTERN theres an ascending triangle pattern happening on the 1h and 4 hour time frame,
really good time to enter, watch the video if you want let me know what you think.
its my first video i make so ill try to make it better next time, i did my technical analysis live but for some reason the video
stop recording and i had to start over but,
im no financial adviser just a passionate trader who likes to see everyone profit,
if you liKe my trading signals like and comment.
i will give you more.
if you disagree or dislike well let me know how you feel
have a great day traders, and lets all help one another be profitable!
cheers

SHIB Goals !Hello,
After a large part of the SHIBA coin was burned and entered into the Bullish pennant , which left us room to enter the currency and buy it before the explosion 🔥

You Are Here. Roadmap to gainsShould the previous pattern continue to hold steady we should be pretty close to another rise in price. Also more volume than previous rally.

ShibaInu USD Meme Token DOGE Killer Things have been vegetating for a moment, but the Momentum is coming right along

MARA next Price Target $76Mara broke out of resistance around $55. If BTC continues its rally then we can see MARA around $75-$80.

BA breakout, long term price target $307 BA breaking out in the weekly chart. If we maintain we can see $244.
Something I noticed while charting BA. The return rate after a bull flag breakout on BA has been consistent for the last two Flags. After a bull flag breakout, BA has returned on average $75 for the past two flags.
If history were to repeat itself with this recent Bull Flag. The return rate of BA would be about 33% if BA would to breakout at $231 and you would enter at this price. I used the two previous Price Ranges to determine a Long Term Price Target of BA and return rate for this recent flag.

TGT long term outlook TGT looking to breakout either from now till March of 2022. for now, it's looking bearish on the weekly chart. Would have to break above $264 to see $276

SQ reversal at $230 SQ is still in the wedge/pennant. $230 is looking to be where this reverses. looks good so far. Would have to break above $274 to see $294

Shib asymmetrical triangle breakout imminent? 1HRAs chart shows, we had recent bullish action after the previous selloff period. After this bullish action, we have formed into what I would call a bullish asymmetrical triangle. So my prediction is hopefully a breakout to the upside out of this triangle later today.
Trade safely and wisely.

ShibaInu Meme Token DOGE Killer Shiba Army has been holding the line. The Support and Momentum is there no matter all the FUD being pumped out there

SHIBUSDT SHORT ✅What we see on SHIB is clear, you see chart was bullish for a period but now is time to recover with bearish position.
JUST BE CAREFUL GUYS, Just take some of your profits then lets it play, you can buy on areas we determined
all areas are determined perfectly nothing to explain guys...
Im looking to buy around 0.000030-35USDT
Any question comment me bellow,
GOOD-LUCK
@FxShzd

Shiba now Breaks the flag pattern 💥🚀Shiba now Breaks the flag pattern 💥🚀📈
Go to the moon 🌙🌚🤒
Let's go ⚡💚

