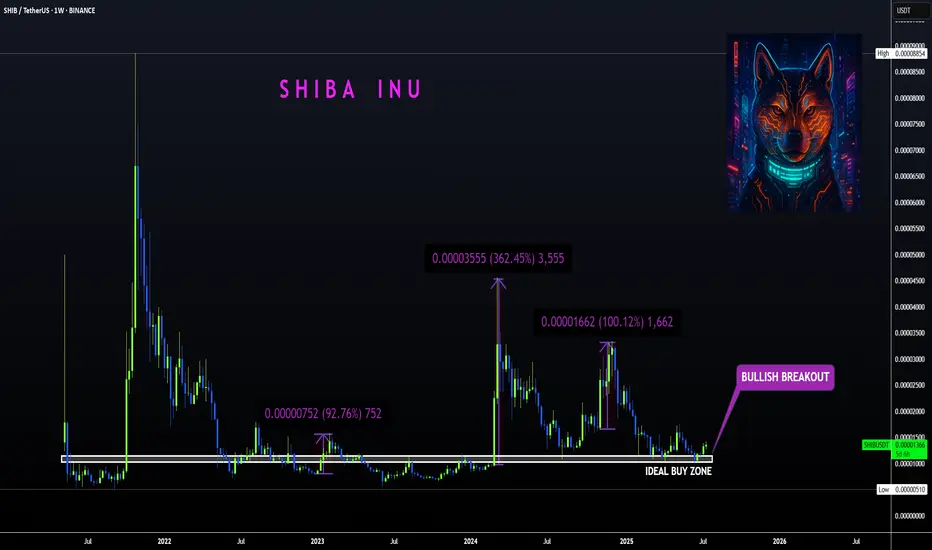
SHIBA | Bullish Breakout ABOVE Ideal Buy ZoneBINANCE:SHIBUSDT
Shiba is know to make big increases in short periods of time... that's why we love it!
The tricky thing about SHIBA is that the pumps can be unpredictable so the best way to ensure a position is to buy as low as possible to the ideal buy zone.
In the weekly timeframe, the technical indicators are not quite bullish yet. The moving averages is still above the price, meaning the bulls have yet to take full control of the price in lower timeframes.
The same can be said for the daily, although we are seeing progress as the 200d moving averages have been reclaimed:
Shibausdt
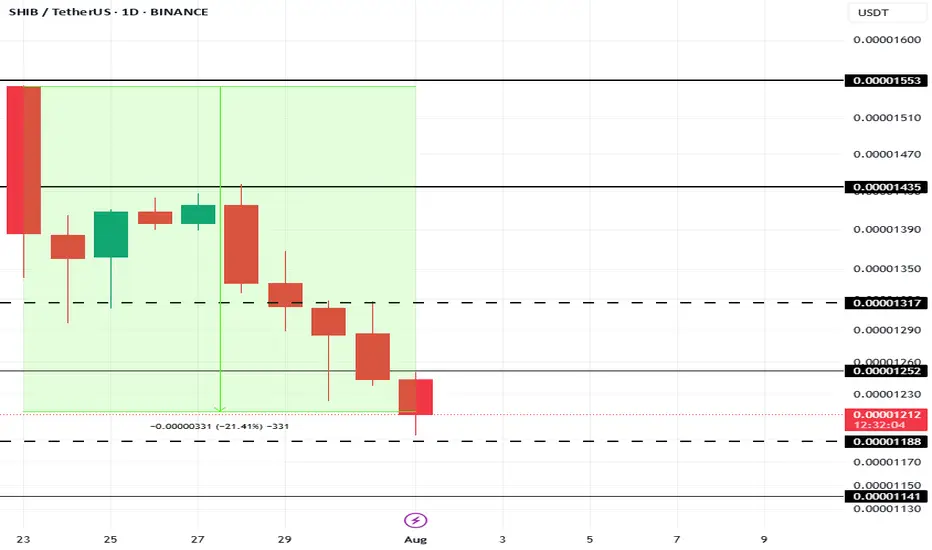
This Is The Cause Of Shiba Inu Price’s 21% Fall In 10 DaysAt present, BINANCE:SHIBUSDT price is sitting at $0.00001210, down 21% over the last 10 days . The drop in Shiba Inu's price can be traced to a sharp decline in the number of new addresses interacting with the token.
In the last 10 days, the number of new addresses has decreased by nearly 40% . This sudden exit of new investors indicates waning confidence in BINANCE:SHIBUSDT price potential, particularly after an extended rally earlier in the year.
If this trend continues, BINANCE:SHIBUSDT could lose the critical support level of $0.00001188, pushing the price down to $0.00001141 or potentially lower. However, if SHIB manages to hold onto its $0.00001188 support level, there is a possibility of recovery.
A bounce from this level could push BINANCE:SHIBUSDT price up to $0.00001317 . Securing this level as support would create a bullish scenario, invalidating the bearish thesis and offering hope for further price growth in the near future.
Here’s Why Shiba Inu Price’s 10% Rise Entails $50 Million LossesAt the time of writing, BINANCE:SHIBUSDT price is $0.00001407, sitting just below the resistance level of $0.00001435. The altcoin has been facing mixed signals, with both bearish and bullish factors playing a role in its price action. The key resistance level of $0.00001435 needs to be broken for a potential recovery.
The liquidation map shows a fascinating development: if BINANCE:SHIBUSDT recovers the 10% losses it has sustained by reaching $0.00001553, it could trigger over $52 million worth of short liquidations . Short sellers have been betting on a decline, but if SHIB rebounds, these traders will face considerable losses.
If BINANCE:SHIBUSDT continues to hover within the consolidation range of $0.00001435 and $0.00001317 , traders will remain safe from liquidation risks. This sideways movement will keep the altcoin within a neutral zone, avoiding drastic price changes in the immediate term.
However, if BINANCE:SHIBUSDT price manages to break the resistance at $0.00001435 and flips it into support, SHIB could potentially climb back to $0.00001553. This would mark a 10% recovery , invalidating the current bearish sentiment and shifting the outlook to a more optimistic tone.

Shiba Inu Whales Amass 4.66 Trillion SHIB As Price Falls 12%BINANCE:SHIBUSDT price is currently trading at $0.00001353, down 11.5% over the past 24 hours . The altcoin is holding above the support level of $0.00001368.
The large holders' netflow for BINANCE:SHIBUSDT has recently spiked, reaching a two-month high. In the last 24 hours, 4.66 trillion SHIB were accumulated by addresses holding at least 0.1% of the circulating supply. These whales, who have collectively invested $63.7 million , are betting on a price rebound.
A successful bounce off $0.00001317 would likely pave the way for further price appreciation, potentially pushing BINANCE:SHIBUSDT to $0.00001553 . Securing this level as support could mark a recovery of today’s losses and initiate a new uptrend, provided the broader market conditions remain favorable.
On the other hand, if BINANCE:SHIBUSDT falls below the support of $0.00001317 due to profit-taking, the meme coin could slip to $0.00001188 . This would invalidate the bullish thesis and further reduce investor confidence. The next few days will be crucial in determining if SHIB can maintain its current support levels .

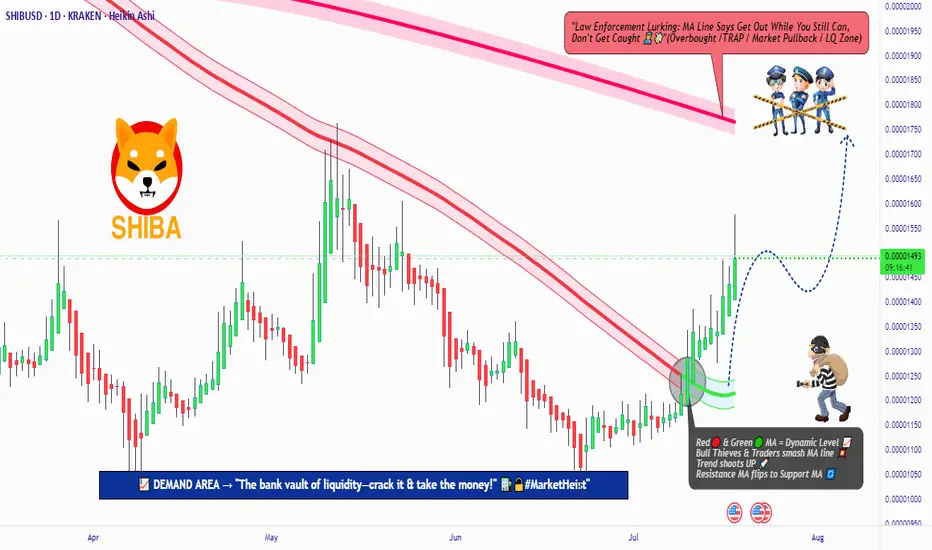
SHIBA INU Heist Plan: Rob the Market, Ride the Bull!💎🚨 "SHIBA INU Crypto Heist Plan: Rob the Market or Get Robbed!" 🚨💎
Thief Trading Style | SHIBA/USD | Bullish Analysis | DCA Heist Strategy | Swing & Scalping Masterplan
🌍 Hey World! 👋 Hola, Ola, Bonjour, Hallo, Marhaba! 🌟
To all the Market Robbers, Bulls in Disguise, and Silent Money Movers — welcome to Thief Trading’s Heist Blueprint 💼🔫 for SHIBA INU vs. USD!
📊 Chart Analysis Breakdown:
Based on my Thief Trading™ Style – a fusion of technical setups, fundamentals, and macro crime-scene evaluations – we’re executing a bold LONG setup targeting a bullish breakout. 🕵️♂️💥
This heist involves breaking past the Police Resistance Checkpoint (moving average red zone), where bearish forces and retail roadblocks stack up.
💹 Heist Entry Strategy:
📍Entry Idea: “The vault's cracked open!”
Longs can be triggered at market price – but wise robbers use precision:
⏱ Place Buy Limit Orders near 15min or 30min swing low pullbacks.
💼 DCA / Layered Entry Method is advised – the more stealthy the approach, the bigger the bag.
🛑 Risk Management:
📌Stop Loss (SL):
Set near recent swing highs/lows on the 1D candle wick zone.
🔒 Example SL: 0.00001300
Remember, SL should scale with your risk appetite, lot size, and number of entries.
🎯 Thief Target:
📍 Target: 0.00001770 or jump off early if the cops (market sellers) start closing in.
You don’t need to wait for the vault to be empty — grab what you can and exit clean.
🔍 Scalper's Shortcut:
Only long-side scalps are valid here.
💰 Big pockets = Fast Entry
💼 Small pockets = Join the Swing Gang
Use Trailing SL to guard your loot and stay agile in the escape.
🧠 Why This Heist? (Fundamentals Insight):
SHIBA/USD is heating up 🔥 due to:
Bullish sentiment in crypto
On-chain activity uptick
Retail momentum shifts
Intermarket cues lining up
📚 Dive deeper into:
📰 News Impact
📊 COT Reports
🔗 On-chain metrics
🧭 Sentiment & Intermarket Guidance
⚠️ Risk Zone Alert:
🚨 News events = Market Chaos
➡️ Avoid fresh entries near news drops
➡️ Use Trailing SLs to lock profits & manage active positions wisely
🙌 Support the Heist Movement:
🔥 Hit the BOOST button if you vibe with the Thief Trading style!
Every boost helps power the team to deliver more precision setups, market heists, and easy-to-follow strategies daily. 💸💎💪
📌 Important Disclaimers:
This is a general market outlook and not financial advice. Always analyze based on your own system and risk tolerance. Markets shift fast — stay updated and adapt.
💬 Comment below if you're on the crew. Let's rob the market together — one chart at a time.
🚀 See you in the next heist, Money Makers! Stay silent, move smart, and steal success! 🤑🐱👤🏆
SHIBUSDT🕯 The key resistance level, identified as the best resistance for a break and pump, stands at 0.0000135, with a potential price increase to 0.00001567 if breached, serving as the next target (Pullback level). On the support side, the main level is observed at 0.0000115, and should the price fall below this, it may decline further to the lower Major Level of 0.0000100.
🔽 Resistances:
Main resistance level: 0.0000135 (potential break for pump)
Next target (Pullback level): 0.00001567
🔼 Supports:
Main support level: 0.0000115
Lower level (Major Level): 0.0000100
⚠️Contorl Risk management for trades.

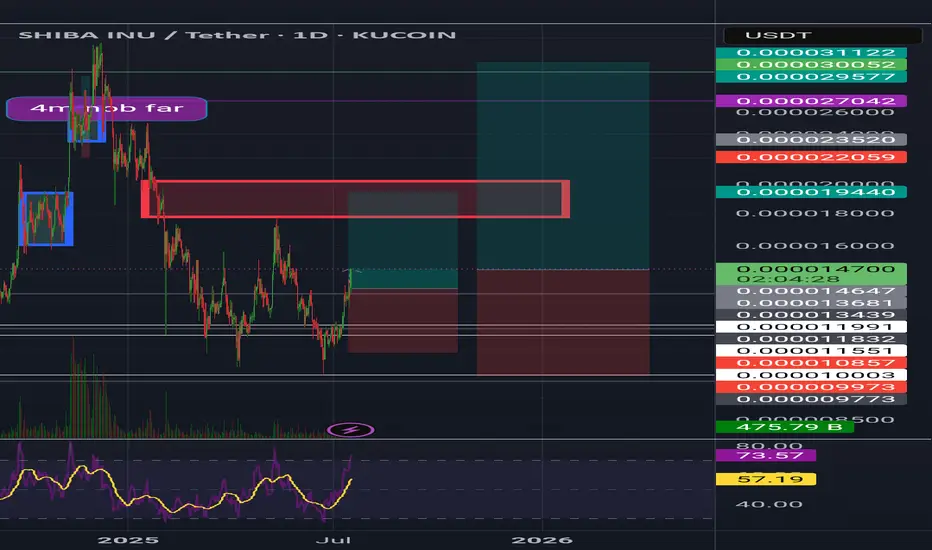
Shiba inuShib usdt Daily analysis
Time frame daily
First target = 0 00001944$
Risk rewards ratio =2 👈👌
Second target = 0.00003
Risk rewards ratio >3.5 👈 👌
The red box that you can see on the screen is very important resistance area.
If Shiba breaks it strongly, second target will be reach
SHIB Long Entry Heist Plan – Bullish Setup in Trap Zone🦹♂️💸 SHIB INU Market: The Silent Heist Plan Is Live! 🚨💰
Thief Trading Style | Swing & Scalping Blueprint | High-Risk Zone Masterplan
🌍 Hello Global Robbers & Market Raiders! 🤑💥
Welcome to another secret mission straight from the vault of Thief Trading Style. We're eyeing the SHIB INU Crypto Market, and the time has come for a stealthy bullish strike!
🧠 The Blueprint – Operation SHIB-INU Break-In
We’re executing a bullish move towards the Yellow MA Zone, a high-risk territory filled with consolidations, trap setups, and a potential reversal. The battlefield is tight, but the rewards are sweet for those who play it smart. 🎯💸
🔑 ENTRY STRATEGY – “Vault Access Granted” 🚪📈
💥 Entry Type: Buy/swing
💡 Zone: Pullback entries near swing lows (within 15–30m timeframes)
🕵️♂️ Stealth Entry – Wait for candle signals or limit orders near key liquidity zones.
🛡️ STOP LOSS – “Secure the Exit” 🛑🔐
📌 Placed just below recent swing low at 0.00001050 (30m TF)
🎯 SL adapts to your lot size, trade size, and number of entries.
🏴☠️ TARGET – “Escape Before Alarms Go Off” 🎯💨
💰 Target: 0.00001350
⏳ Optional: Trail your SL and exit on signs of exhaustion.
💼 Scalpers’ Side Mission – “Quick Loot Runs” 🧲⚡
Scalp only on the Long side; use trailing SLs and follow the robbers’ path.
Big wallets? Enter now. Small bags? Wait and follow the swing wave. 🕶️🚀
🧠 Strategic View
Market sentiment remains bullish, but the zone is volatile.
Use macro analysis, COT data, on-chain insights, and sentimental clues for confirmation. 🧠📊
⚠️ Important Notice – Market Hazards Ahead 📉📰
🔔 Watch out for major news releases!
✔️ Avoid new trades during high-impact events.
✔️ Use trailing SLs to guard profits.
✔️ Monitor market developments regularly – stay one step ahead.
💖 Support the Mission
If you love this robbery blueprint, 💥Hit the Boost Button💥 and join the Thief Trading crew for more profitable adventures! Every click fuels our next plan. 🏆💪❤️
📢 See You in the Next Raid!
Stay tuned for more high-stakes missions and daily loot setups!
📲 Follow for the next crypto break-in.
🐱👤🚨 Thief Traders never sleep... we scan, we strike, we secure the bag.

SHIBUSDT Bounces Strongly from Wedge SupportSHIBUSDT is forming a bullish falling wedge on the weekly chart, showing signs of reversal after bouncing from key support at 0.00001000. A breakout above the wedge resistance could trigger strong upside momentum in the coming weeks.
Entry at current price
Stop Loss: .00000890 (Below the Wedge Support)
TP1: 0.00001700
TP2: 0.00003100
TP3: 0.00007000
$1000SHIBUSDT CRYPTOCAP:SHIB

SHIBA +100%?? | BEST Buy OPPORTUNITYSHIBA has been in a downtrend for many weeks.
From here, upside is likely - especially if we look at the consecutive amount of "red" weekly candles (blue on this chart).
A 40% bounce zone is easily possible from this zone. Even at modest, 20% would be ideal:
____________
BYBIT:SHIBUSDT

SHIBUSDT: Price Weakness & Your Next Short OpportunityMy focus is on SHIBUSDT, and the picture is clear: price is weak. This isn't a market where buyers are proving their strength; in fact, the opposite is true.
Most traders are confused by volatility. But you need to see the real opportunity. My analysis points to this: both red boxes I've marked on the chart are prime zones for short opportunities. They represent powerful selling regions.
Here's why, and your plan for action:
Red Box Power: These zones are where sellers are truly in control. I'm actively looking for price to engage with these areas.
Green Box Uncertainty: As for the green box, its strength is questionable. I'm not confident it will hold as reliable support for a bullish move, reinforcing my overall bearish view.
Confirm the Downside: Your decisive move comes with confirmation:
Volume Footprint: I'll be scrutinizing the volume footprint to see clear distribution from sellers.
CDV (Cumulative Delta Volume): Look for CDV to turn deeply negative, affirming seller dominance.
LTF Breakdowns: On the low timeframes (LTF), demand concrete breakdowns. Price must fail, retest the red boxes as resistance, and then continue lower. This is your undeniable signal.
My general bias remains bearish. I only trade assets showing a sudden increase in volume, and while this is a short setup, the volume dynamics confirming weakness are what I'm seeking.
Keep a sharp eye on those red boxes. If these confirmations line up, you'll uncover precise, high-probability short entries. This is where smart, confirmed decisions are made.
📌I keep my charts clean and simple because I believe clarity leads to better decisions.
📌My approach is built on years of experience and a solid track record. I don’t claim to know it all but I’m confident in my ability to spot high-probability setups.
📌If you would like to learn how to use the heatmap, cumulative volume delta and volume footprint techniques that I use below to determine very accurate demand regions, you can send me a private message. I help anyone who wants it completely free of charge.
🔑I have a long list of my proven technique below:
🎯 ZENUSDT.P: Patience & Profitability | %230 Reaction from the Sniper Entry
🐶 DOGEUSDT.P: Next Move
🎨 RENDERUSDT.P: Opportunity of the Month
💎 ETHUSDT.P: Where to Retrace
🟢 BNBUSDT.P: Potential Surge
📊 BTC Dominance: Reaction Zone
🌊 WAVESUSDT.P: Demand Zone Potential
🟣 UNIUSDT.P: Long-Term Trade
🔵 XRPUSDT.P: Entry Zones
🔗 LINKUSDT.P: Follow The River
📈 BTCUSDT.P: Two Key Demand Zones
🟩 POLUSDT: Bullish Momentum
🌟 PENDLEUSDT.P: Where Opportunity Meets Precision
🔥 BTCUSDT.P: Liquidation of Highly Leveraged Longs
🌊 SOLUSDT.P: SOL's Dip - Your Opportunity
🐸 1000PEPEUSDT.P: Prime Bounce Zone Unlocked
🚀 ETHUSDT.P: Set to Explode - Don't Miss This Game Changer
🤖 IQUSDT: Smart Plan
⚡️ PONDUSDT: A Trade Not Taken Is Better Than a Losing One
💼 STMXUSDT: 2 Buying Areas
🐢 TURBOUSDT: Buy Zones and Buyer Presence
🌍 ICPUSDT.P: Massive Upside Potential | Check the Trade Update For Seeing Results
🟠 IDEXUSDT: Spot Buy Area | %26 Profit if You Trade with MSB
📌 USUALUSDT: Buyers Are Active + %70 Profit in Total
🌟 FORTHUSDT: Sniper Entry +%26 Reaction
🐳 QKCUSDT: Sniper Entry +%57 Reaction
📊 BTC.D: Retest of Key Area Highly Likely
📊 XNOUSDT %80 Reaction with a Simple Blue Box!
📊 BELUSDT Amazing %120 Reaction!
📊 Simple Red Box, Extraordinary Results
📊 TIAUSDT | Still No Buyers—Maintaining a Bearish Outlook
📊 OGNUSDT | One of Today’s Highest Volume Gainers – +32.44%
📊 TRXUSDT - I Do My Thing Again
📊 FLOKIUSDT - +%100 From Blue Box!
📊 SFP/USDT - Perfect Entry %80 Profit!
📊 AAVEUSDT - WE DID IT AGAIN!
I stopped adding to the list because it's kinda tiring to add 5-10 charts in every move but you can check my profile and see that it goes on..

Shiba Inu Crypto: A Useless Coin That Can Still Make You RichHey everyone, welcome back to a new supply and demand crypto analysis. Today, I will analyse one of the most unexpected — but potentially lucrative — investment opportunities in the crypto space right now: Shiba Inu Metaverse crypto.
Yeah, I know what you’re thinking… “Isn’t Shiba Inu just another meme coin?”
And yes, fundamentally, it’s not trying to solve world hunger or revolutionise finance. But guess what? You don’t need a coin to be helpful to make money from it.
All you need is to understand price action and supply and demand. That’s it.
What is Shiba Inu?
So let’s break it down. Shiba Inu started as a meme — a direct competitor to Dogecoin. It’s an ERC-20 token on the Ethereum network with a massive circulating supply and a huge following. Over time, it has evolved and launched its own ecosystem — including Shibarium, SHIB: The Metaverse, and other utilities.
But let’s be real: Shiba Inu is not about real-world utility. It’s about speculation, community hype, and timing the market right based on simple but powerful trading concepts.
Daily Timeframe is Trending UP
Right now, things are shifting in our favour on the daily timeframe. We’ve just entered an uptrend — a key change in market structure — and more importantly, we’ve got a new imbalance forming around $0.00001320. This is the next key level where we’re waiting to re-enter the market.
Why wait? Because smart investors don’t chase candles. They wait for the price to return, where demand will likely kick in again. That level is $0.00001320. Once price returns there and confirms demand, we buy — and we ride the next wave.

$SHIBUSDT – Major Retest Holding!CRYPTOCAP:SHIB is retesting a key breakout zone after breaking through a long-term descending trendline + 200 EMA. The structure remains bullish with a clean higher-low forming at the confluence of support.
📊 Technical Breakdown:
Breakout from descending triangle
Bullish retest of trendline + 200 EMA
Price printing higher lows above key support
🎯 Targets:
TP1: 0.000015252
TP2: 0.000017091
TP3: 0.000018929
🛑 Stop-loss: 0.000013153
📍 Entry Zone: Around 0.000014785
If bulls hold this zone, SHIB could see continuation toward mid-May highs and beyond.

SHIBUSDT – Perfect Confluence Zone Holding Strong!CRYPTOCAP:SHIB has just bounced from a critical confluence zone, combining:
✅ Channel support
✅ Previous breakout zone
✅ Golden pocket retracement
This triple-layered support has historically acted as a powerful launchpad, and the price is already showing early signs of strength.
The price structure is tightening inside a long-term wedge, and a breakout from the upper resistance trendline could trigger a massive upside leg.
First breakout test near 0.024
Potential long-term move toward 0.07+
In shorter timeframe, CRYPTOCAP:SHIB broke out of its long-standing falling wedge pattern and is now retesting the breakout zone. With bullish volume creeping in, this move could ignite a powerful trend reversal toward the 0.0000239 zone. Ideal structure for spot entries with defined risk!
SHIB could be coiling for something massive. Keep an eye on structure and volume.
If you find this analysis helpful, please hit the like button to support my content! Share your thoughts in the comments, and feel free to request any specific chart analysis you’d like to see.

#SHIB/USDT#SHIB
The price is moving within a descending channel on the 1-hour frame, adhering well to it, and is on its way to breaking it strongly upwards and retesting it.
We are seeing a bounce from the lower boundary of the descending channel, this support at 0.00001100.
We have a downtrend on the RSI indicator that is about to break and retest, supporting the upward trend.
We are looking for stability above the 100 moving average.
Entry price: 0.00001224
First target: 0.00001284
Second target: 0.00001344
Third target: 0.00001417

SHIB/USDT BUYHello friends
Given the price reaching resistance and price correction, there is a good opportunity to buy...
Here we suggest you buy step.
We have also specified price targets for you.
*Trade safely with us*

SHIBA update#SHIBA can make another down wave because it made a triangle with 5 waves
there is a down wave before the triangle which is wave A
the whole triangle is wave B
now we are waiting for wave C
its the last correction before making new highs
check out our last analysis on shiba in higher time frames

SHIBA INU looks to be setting up for a move to the upside soon.SHIBA INU has lost nearly all of its gains from the 'Trump election pump,' and is currently down about 45% from the high it set in December. It is trading in the bottom range of the descending wedge pattern, below equilibrium. Sweeping the Nov 4th 'Trump pump' starting point could indicate a big move to the upside, potentially challenging the high set in December.
Good luck, and always use a stop loss!

SHIBA INU Cup & Handle could signal potential 300% plus gains!Shiba Inu has left holders very disappointed after the 'Trump Pump' seemingly left it behind, as other, more sought-after altcoins made life-changing gains. However, it does appear that Shiba may still have a few tricks up its sleeve. If this pattern holds true, we could see Shiba make gains upwards of 300% over the next 2 to 6 months. Watch the fair value gap area for potential buy orders, as this area held up nicely in the past.
Good luck, and always use a stop-loss!

SHIB 50% profitThis chart presents a trading opportunity for SHIB/USDT with clear take-profit (TP) levels and a promising uptrend cycle. 📈
Analysis:
The yellow moving average (MA) highlights a trend shift to bullish momentum. SHIB's price has crossed this line, indicating a potential breakout. 🚀
A strong support level is visible near 0.00002139, preventing further downside. 🛡️
The green zone represents the risk-free entry point, suggesting limited downside risk if proper stop-loss levels are respected. ✅
Targets are clearly defined:
TP1: 0.00002373 🎯
TP2: 0.00002641 🥈
TP3: 0.00003212 🥇
A big uptrend cycle suggests SHIB could reach these targets as it attracts more buyers. 🐂
Strategy:
Entry Zone: Current price levels around 0.00002139 are favorable for opening long positions. 💹
Stop Loss: Place at 0.00002019 to limit risks. 🛑
Profit-Taking: Gradually secure gains at each TP level. 📊
Market Sentiment:
Volume bars show increasing participation, signaling that buyers are stepping in. If this continues, SHIB is likely to hit its targets. 🔥
Final Note:
This is a low-risk, high-reward setup based on technical indicators and market structure. Always monitor the market for sudden changes and stick to your plan. ⚠️

SHIB is gonna range for now!CRYPTOCAP:SHIB
Shib might started to be in a parallel channel which means price will range for now!
Nothing else can be expected for now.😒😒😒
⚠️ Disclaimer:
This is not financial advice. Always manage your risks and trade responsibly.
👉 Follow me for daily updates,
💬 Comment and like to share your thoughts,
📌 And check the link in my bio for even more resources!
Let’s navigate the markets together—join the journey today! 💹✨

Shiba Long For Today
During the active morning of Friday Jan 3rd, 2025, Forecasting shiba to be long this morning

$SHIBAMy humble View on SHIBA INU
We can agree to disagree, but I’ve conducted my analysis based on the Daily timeframe (TF) down to the 15-minute chart for entry. These two areas (marked by blue lines) are on my watchlist. If the confluences align optimally, I plan to enter a position at these levels. My target is to exit 60–70% of my entry position near the Daily resistance level.
Good luck!
