SHIB in deepwater. Whats next? 2013 | 2018 | 2020 | Bounce back has always been better. Is crypto our future assets? many agree, while big whales disagree to put you off? Panic always played in market favour, so what will you do?
Shibausdt

Shibusd 1D Strong buyback after yesterday's fallFrom the beginning of 2022 the price of SHIBUSDT moves a smooth down channel with a price range of 100%
Usually the price moves in the upper part of the channel, but when the SHIBUSD price breaks below middle of chanel to the lower part, the fall is -40-50% in 1-2 days. It happened yesterday.
However, today the buyers of Shibainu showed great interest in the coin, and today's day candle of growth almost equal in size to yesterday's fall. Shib buyers showed one of the best results of buyout after yesterday's fall, which gives a good reason to follow this asset and bribe it in the long run.
Ideally, we would not want the price of SHIBUSDT to fall below $0.000015, there would be an ideal point to enter the long.
Well, the first target from above, in our opinion, is in the area of $0.000027
_______________________________
Since 2016 , we have been analyzing and trading the cryptocurrency market.
We transform our knowledge, trading moods and experience into ideas. Each "like under the id ea" boosts the level of our happiness by 0.05%. If we help you to be calmer and richer — help us to be happier :)

Why are you so confident in a long position SHIB?We have seen a lot of posts about a good SHIB long, and we want to suggest that you consider an alternative scenario
There is such a logical chain: Elon Musk pampil on Twitter DOGE, DOGE is a meme token, SHIB is also a meme token, Musk bought Twitter and DOGE increased in price, which means SHIB will also increase in price, perhaps in the short term, yes, and the SHIB team is developing a project that can in long-term to ensure the growth of the value of the coin.
However, we suggest you consider this option:
1D we see an impulsive growth and the start of a correction, given that this is a three-wave correction, then most likely the triangle that is drawn can act as wave b, therefore, we can expect a trip for the stops of people who were campaigned in favor of buying, buying off by strong players, after which we can say that the correction is over , are you ready to sit out -40% in case of going down?
If you want to buy or submit inside the rectangle, then we advise you to wait for a beating before entering a trade


SHIB Shiba Inu Support LineSHIB Shiba Inu is defending well the support line, close to an oversold RSI, and looking for a reversal.
My price target is $0.00002950.
Looking forward to read your opinion about it.

SHIBA USDT Ready for the fall?The daily support will be the last level where we can see a bounce, if not that's going straight to the next one.

Advanced Level Hi everyone,
A point of strong support and a potential target are shown in the chart..
Elliott Wave within a 5 wave move:
Complex Correction with Small Wave x:
Regular Flat (inverted)
Target = $ 0.0000417

GMTUSDT 4HHi Guys, very important days for markets because of FED , I update charts for you to get better decision.
👤SecondChanceCrypto
📅04.May .22
⚠️(DYOR)
Thanks for your Likes and Comments


SHIB - Trade Setup ✅Let's see how SHIB is behaving.
This is a 1H chart. (Short Term)
Here is your trade setup:
Open your short positions once the price drops under the green support area.
And open your long positions once the price passes the orange resistance level.
Wait for confirmation before opening positions.
The RSI shows that ETH is below the 50 levels, the center.
If you want to know how the RSI indicator works, take a look at this Educational Idea. It'll help you have better readings:
Current Market Price: $0.00002073
Let me know your ideas.
Good luck.

An attractive idea (update6)An overview for those who know what to do Wait for the moves not soon but in the near future

Shiba +4R Trade !Called out this trade with +4r in Profit already . Was a quicl scalp trade . Already TP 1 and 2 taken , hoping it would fall further to 2080 support .

SHIB support level to defendSHIB Shiba Inu is at the key support level of $0.00001800 from which it bounced this year, in January.
If it breaks bellow $0.00001700, then it can go back to $0.00001200.
i think we can see a reversal from this area to the $0.00002950 resistance.
Looking forward to read your opinion about it.

SHIBUSDT TOWARD BULLISHAs noticed that the SHIBUSDT in its downward direction till meet the triangle pattern vertex, once it reaches the vertex it will reflect in upward long position as the downside is an extremely supported at that price level.

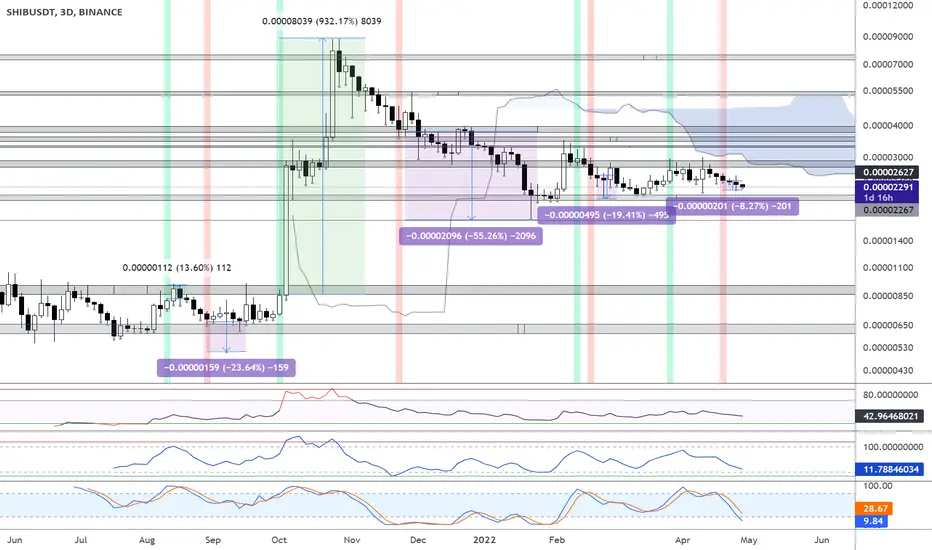
SHIB Analysis - still correcting since bullish 932% signal.SHIB going sideways for months now between 2106 and 2725.
SHIB corrected 8.27% after the latest Supertrend Ninja - Clean signal on the 19th Jan (red vertical line on the background). But in general SHIB has been in a correcting downwards trend for 6 months now. Since the bullish (green vertical line) of the Supertrend Ninja - Clean on 1 Oct 2021. Which made a whopping +932%. In less than 8 months the Supertrend Ninja gave 4 bearish signals, whereafter a correction followed.
Let's have a look at the other indicators. The Stoch RSI is in oversold levels, but it hasn't crossed up to the blue area yet. Also the price is below the Ichimoku cloud , which is bearish. The Constance Brown is in oversold area as well. The RSI is range bound (40-60).
Bouncing up here 2725 USDT is the next target. Dropping here 2106 USDT is the next target. 1694 USDT thereafter. The Supertrend Ninja - Clean hasn't given a bullish signal for the time being (green vertical line on the background). If SHIB does bounce up here, it would be making a higher low. Supports and Resistances are highlighted as grey blocks.
Thank you for reading.
Namasté 🙏
Disclaimer: Ideas are for entertainment purposes only. Not financial advice. Your own due diligence is highly advised before entering trades. Past performance is no guarantee of future returns.
What Indicators Do I Use:
In the chart I am using the "Supertrend Ninja - Clean", which is a trend-following indicator (Green and red vertical lines on the background). When the background of the candlestick closes green (vertical line). It indicates a possible bullish (up)trend. And red for downtrends.
SHIBUSDT A very risky set yet very rewarding -longThis meme coin might be on its ending diagonal of the corrective wave 2 and that when validated may further resume its impulsive wave 3.
Risk plays a really major role here and exercise due risk management and with proper allocation.
#elliotwaveforecast
@marketpainterPH

SHIBA LongHey traders, in today's trading session we are monitoring SHIBA for a buying opportunity around 0.22 zone, once we will receive any bullish confirmation the trade will be executed.
NOTE: All of the bot accounts in the comment section complimenting some fake companies are SCAM.
Please stay aware and like this comment so it gets.

Shiba Inu longShiba Inu bounced off the ascending trendline. Asset bounced off the support area. Bullish movement to resistance level at 0.0000274 is expected to happen.

Good time to long shiba inuNew weekdays are coming. BTC seems to go up from here.
Shib is at the bottom of the triangle. Should long now and if it breaks, then we can expect 27 minimum.
Entry: 2250 - 2300
Exit: 2730
Stop Loss: 2175

The secret graphic of Shytoshi KusamaI have been searching in Internet how to communicate with alien because of Shiba to the moon

SHIBUSD Break Above DowntrendSHIBUSD has shown a break above the dominating downtrend on the right side chart
On the left SHIBUSD on a different pair is also showing bullish signs, with a descending scallop formation
The big take away is that a big support has been reached with a triple bottom, bullish action will prevail and lead to 200MA continuation

Daily Bullish Divergence SHIBHi guys, this is my personal view of how the prices is gonna shoot in the next days. Thanks for the comments.

SHIBA UPDATE (BUY/DOUBLE)- on the daily chart : shiba gave us a green candle confirming the uptrend .
- on the 15 min chart : we can see the price broke the VWAP upwards and bounced off it again after the first breaking
- best move : buy or double you're position
