SHIB New Update/Roadmap (3D)The correction for this coin started from the point where we placed the red arrow on the chart.
The price appears to be inside a Triangle or Diametric, nearing the end of wave D.
The green zone is a low-risk rebuy area.
There is a liquidity pool on the chart, which we expect to be swept soon.
Targets are marked on the chart.
A weekly candle close below the invalidation level will invalidate this analysis
For risk management, please don't forget stop loss and capital management
When we reach the first target, save some profit and then change the stop to entry
Comment if you have any questions
Thank You
Shibbtc

SHIB To start exiting the downtrend, Shiba must first break its downtrend line and reach and cross the 0.00001856 area, which is also an important resistance.
Unfortunately, in the daily time frame and in the range of 0.00001916, the probability of a death cross is very high, and if it happens, a worse downtrend will be expected.
But if it can close a strong candle above 0.00002123 in the 8-hour time frame, the death cross will be invalidated.
My targets for the next 2 months for Shiba can be 0.00004807 and 0.00007078.
In the event of a correction and market decline, the number 0.00001028 will be available.
Shiba is dependent on the positive movement trend of Ethereum, so it can be said that with the rise of Ethereum, Shiba will also be bullish.

SHIB is about to explode soon!On the chart we have a big triangle which is a continuing triangle and the wave before this triangle was also bullish.
From where we placed the red arrow on the chart, this triangle has started to form.
Wave D now appears to be ending. Wave D is diametric.
On the green range, wave E can end and then a bullish wave begins.
The target of the move after the triangle can be the break of the ATH
Closing a daily candle below the invalidation level will violate this analysis
For risk management, please don't forget stop loss and capital management
Comment if you have any questions
Thank You

SHIB buy/long setupAn important trigger line has been broken on the chart. I have a bullish iCH chart. The larger structure is bullish.
We should look for buy/long in the support ranges.
We are looking for buy/long in the specified range of demand.
Closing a daily candle below the invalidation level will violate this analysis
Do not enter the position without capital management and stop setting
Comment if you have any questions
thank you

SHIB looks bullish (1D)SHIB seems to be bullish. From where we put the red arrow on the chart, it looks like a triangle is formed, and we are now in wave E of this triangle.
By hitting the green range, we expect another pump from SHIB.
The targets are marked on the picture.
Closing a daily candle below the invalidation level will violate this analysis.
For risk management, please don't forget stop loss and capital management
When we reach the first target, save some profit and then change the stop to entry
Comment if you have any questions
Thank You

#SHIB/USDT#SHIB
The price is moving in a bearish channel on a 4-hour frame and is adhering to it to a large extent
The price rebounded well from the green support area at the support level 0.000022000, which is a strong level.
We have a trend to hold above the Moving Average 100, which is strong support for the rise
We have very strong oversold resistance on the RSI indicator to support the rise, with a downtrend about to break higher
Entry price is 0.00002350
The first goal is 00.00002570
The second goal is 0.00002700
The third goal is 0.00002900

#SHIB/USDT#SHIB
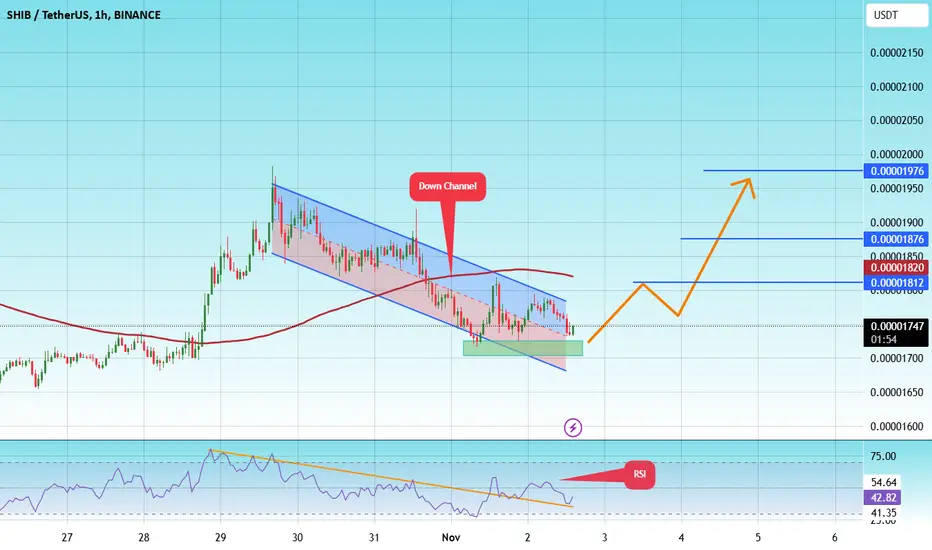
The price is moving in a descending channel on the 1-hour frame upwards and is expected to continue.
We have a trend to stabilize above the moving average 100 again.
We have a downtrend on the RSI indicator that supports the rise by breaking it upwards.
We have a support area at the lower limit of the channel at a price of
0.00001721
Entry price 0.00001742
First target 0.00001812
Second target 0.00001876
Third target 0.00001976
SHIB Looks BullishShiba appears to be entering a bullish wave C.
By maintaining the green range that overlaps with the KEY level, it can go to the ATH.
You should not have an emotional entry, you must have a set position to enter.
Shiba's market cap is 13B, which is a bit heavy, and you shouldn't expect big profits from this coin.
The target is above ATH
Closing a daily candle below the invalidation level will violate this analysis
For risk management, please don't forget stop loss and capital management
When we reach the first target, save some profit and then change the stop to entry
Comment if you have any questions
Thank You

SHIB Is BullishFrom where we put the green arrow on the chart, it looks like a big bullish triangle is over.
By maintaining the green range, it can move towards the targets.
The targets are marked on the chart.
Closing a daily candle below the invalidation level will violate the analysis
For risk management, please don't forget stop loss and capital management
When we reach the first target, save some profit and then change the stop to entry
Comment if you have any questions
Thank You
Shiba Inu | SHIB analysisThe price of Shiba Inu is $0 .0000 116 today with a 24hour trading volume of 355 million dollar. This represents a 3% price increase in the last 24 hours and a 7% price increase in the past 7 days.
Data from the Ethereum blockchain has revealed that the recently launched Koyo token project has moved forward with a major burn of the meme inspired cryptocurrency Shiba Inu , helping its burn rate skyrocket.
According to the data, first spotted by users on Twitter, Koyo burned an astounding 1.49 billion SHIB tokens in a transaction that helped the burn rate of the meme-inspired cryptocurrency surge over 30,000% in the last 24-hour period. this isn’t the first time Koyo has burned a large amount of SHIB, as earlier this year the project moved 1.1 billion tokens to a dead wallet as well. Koyo, which exclusively debuted on the ShibaSwap DEX last month, has aided Shiba Inu in diminishing its vast supply by 8.75 billion SHIB tokens through various transactions directed to “inferno” addresses since its inception. Shytoshi Kusama, SHIB’s lead developer, recently shared his thoughts on the relationship between Shiba Inu’s price and burns in a telegram chat. According to Kusama, the price of Shiba Inu cannot be influenced solely by burns.
In response, the Shiba Inu team has been focused on developing new technologies and utilities to foster SHIB adoption. Kusama believes that only through such efforts can Shiba Inu prices experience the significant increase that everyone desires.a massive SHIB whale has recently expanded its portfolio to nearly 5 trillion tokens after adding an additional 171.68 billion SHIB for around $1.88 million through four different transactions.notably, data from IntoTheBlock has shown that a significant portion of SHIB tokens are now in the hands of long-term investors, highlighting the growing allure of the token among those with an extended investment outlook.according to the firm’s data, holders who have retained their SHIB tokens for over a year cumulatively possess 687.17 trillion CRYPTOCAP:SHIB , valued at more than $7.20 billion. These long-term investors now command nearly 70% of Shiba Inu’s circulating supply.
Meanwhile cruisers or market participants who have held their Shiba Inu tokens for one to 12 months, account for 232.54 trillion CRYPTOCAP:SHIB , equating to over $2.43 billion in value. This group represents 23.65% of the token’s total supply.
Lastly traders or those who have maintained their SHIB holdings for less than a month, control 63.55 trillion SHIB, which amounts to over HKEX:650 million and constitutes less than 6.5% of the cryptocurrency’s overall supply. Meanwhile the beta test network for Shibarium is named PUPPYNET. As per the blockchain explorer BlockScout, currently (i.e., as of 8:37 a.m. UTC on April 15, the beta version of Shibarium has successfully executed more than 3,234,886 transactions. Data from this PUPPYNET explorer indicates that the number of wallet addresses utilizing Shibarium beta has reached 5,833,825. Presently, the gas fees are 1.01 Gwei, which is virtually cost-free. now lets talk about the price
shib army are ready for 0. 000012 , 0. 000013 and 0. 0000135

SHIB looks bearishFrom where we placed the red arrow on the chart, SHIB has entered correction.
Considering the time of the waves and the price range, the correction seems to be a diametric.
The price is expected to reject downwards from the red range.
The targets are clear on the chart.
Closing a daily candle above the invalidation level will violate the analysis
For risk management, please don't forget stop loss and capital management
When we reach the first target, save some profit and then change the stop to entry
Comment if you have any questions
Thank You

SHIBUSDT#SHIB CRYPTOCAP:SHIB has broken the downtrend, sustained above the resistance, and completed the retest. This gives us a bullish signal. We can position ourselves accordingly.

TURBOUSDT Don't miss the flightIs another currency like bonk coming
Yes
Turbo does not travel to the moon
But
It will go to Mars
Community Verified icon

SHIBA - Buy here, do not miss next pump! (HUGE)Shiba Inu will definitely go higher later this year. Right now, we need to catch the bounce and ride the next wave to the upside. The 0.618 FIB retracement seems to be a great level to buy Shiba Inu, which is at 0.00002249. It's always important to do an Elliott Wave technical analysis for such pumps to stay in full picture. We need to see the full market structure and map of the uptrend. I suggest waiting for a bullish flag or any bullish pattern, or just simply setting your limit order to buy SHIB lower! I am very bullish on this coin, and the next profit target is 300% away!
What Is SHIBA INU (SHIB)?
SHIB is a decentralized, community-led currency held by millions across the globe. Since its inception in late 2020, the Ethereum-based SHIB token has grown to become a worldwide phenomenon, and is now accepted as a form of payment at hundreds of locations, either directly or through third-party intermediaries.
Shiba Inu coin was created anonymously in August 2020 under the pseudonym "Ryoshi." Ryoshi says about himself that he is a nobody and not important and that the efforts to unmask his identity, even if successful, would be underwhelming.
This meme coin quickly gained speed and value as a community of investors was drawn in by the cute charm of the coin paired with headlines and tweets from personalities like Elon Musk and Vitalik Buterin.
Since release SHIB now trades on the ecosystem's proprietary DEX, ShibaSwap.

SHIBUSDT#SHIB CRYPTOCAP:SHIB has formed a very promising chart pattern for us. It has broken the resistance of the wedge formation, confirming the bullish momentum. One of the best indicators, TD Sequential, has given a bullish signal after a long time. Successively, it is expected to reach Fibonacci targets at 0.61, 0.78, and 1 levels. Since #dogecoin has already started its uptrend, #shibcoin is likely to follow suit.

SHIBA's correction will continueAccording to the structure of the waves, it seems that the SHIBA correction will continue.
The correction has started from where we entered "START" on the chart.
It seems that we are in an ABC or a more complicated pattern.
Wave B looks like a triangle with only one wave left.
We expect another downward wave from the red range.
Closing a daily candle below the invalidation level will violate the analysis
For risk management, please don't forget stop loss and capital management
Comment if you have any questions
Thank You

#SHIB/USDT#SHIB
The price is moving in a downtrend on a 12-hour frame, within which the price is moving
We have a major support area at Saad 0.00002450
We have a higher stability moving average of 100
We have a downtrend on the RSI that is about to bounce back
Entry price is 0.00002600
The first goal is 0.00003000
The second goal is 0.00003400
The third goal is 0.00003760

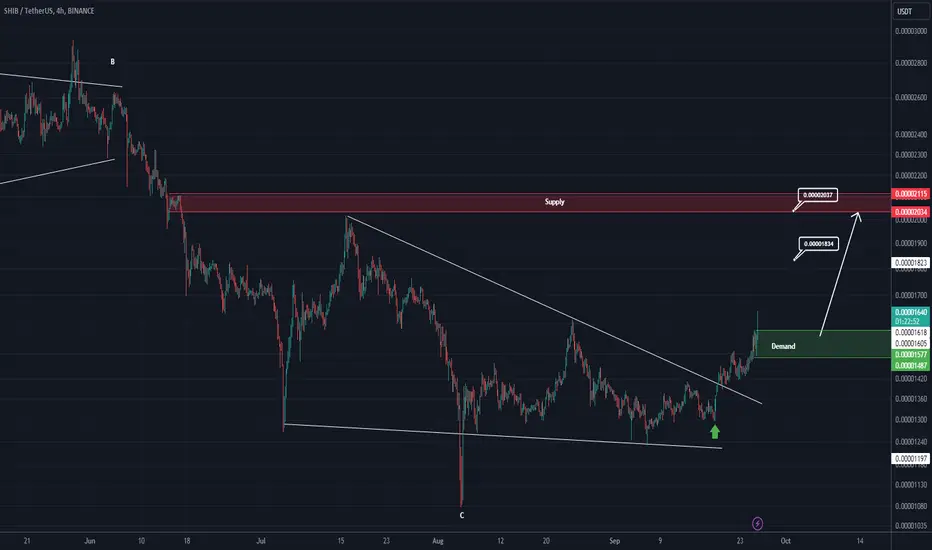
SHIB look bearishConsidering the lower L's, it seems that SHIB intends to move towards the specified demand
By maintaining the supply range, it can drop the demand side.
Closing a daily candle above the invalidation level will violate this analysis
Note that the financial market is risky, so:
Do not enter any position without confirmation and trigger.
Do not enter a position without setting a stop.
Do not enter a position without capital management.
When we reach the first TP, save some profit and try to move the stop continuously in the direction of your profit.
If you have any comments please post them, comments will help us improve our performance
Thanks

"Let's be realistic with SHIB" - Is 2400% realistic enough ?#SHIB/USDT #Analysis
Description
---------------------------------------------------------------
+ SHIB is currently looking to breakout from its resistance zone
+ I see a clear bullish divergence with the RSI and price. Overall SHIB is showing a bullish signs
+ For the long term trade, i'm planning to enter a position at the current price.
---------------------------------------------------------------
VectorAlgo Trade Details
------------------------------
Entry Price: 0.00001133
Stop Loss: 0.00000767
------------------------------
Target 1: 0.00001371
Target 2: 0.00001601
Target 3: 0.00001956
Target 4: 0.00002466
Target 5: 0.00002976
Target 6: 0.00003944
------------------------------
Timeframe:1W
Capital: 1-2% of trading capital
Leverage: 3-7x
---------------------------------------------------------------
Enhance, Trade, Grow
---------------------------------------------------------------
Feel free to share your thoughts and insights.
Don't forget to like and follow us for more trading ideas and discussions.
Best Regards,
VectorAlgo

Shib Charting from Oct 2021This has to be the most detailed chart I have done. I’m just sharing the chart in hopes someone finds some value in it.

SHIB ANALYSIS (4H)SHIBA can move towards the specified targets on the chart by maintaining the green range.
It seems to be in a range and is fluctuating.
Closing a 4-hour candle below the invalidation level will violate the analysis
For risk management, please don't forget stop loss and capital management
When we reach the first target, save some profit and then change the stop to entry
Comment if you have any questions
Thank You

"Shiba Inu Gears Up for Bull Run: Chart Analysis"Shiba Inu: Is the Chart Hinting at a Massive Bull Run?
In the world of cryptocurrencies, few tokens have captured the attention and imagination of traders and investors quite like Shiba Inu. Often dubbed as the "Dogecoin Killer," Shiba Inu has garnered a loyal following and sparked fervent discussions across online forums and social media platforms. As the crypto market continues to evolve, all eyes are on Shiba Inu's chart, which some analysts believe could be signaling the start of a massive bull run.
Understanding Shiba Inu
Shiba Inu (SHIB) is an Ethereum-based cryptocurrency that emerged in August 2020 as an experiment in decentralized community building. Named after the popular Japanese dog breed, Shiba Inu quickly gained traction, riding on the coattails of the Dogecoin phenomenon. With its playful branding and vibrant online community, Shiba Inu has become synonymous with the meme coin movement, drawing comparisons to its canine counterpart, Dogecoin.
The Chart Dynamics
Analyzing the chart dynamics of Shiba Inu provides insights into its potential for a bullish breakout. Over the past year, Shiba Inu has exhibited periods of volatility, punctuated by sharp price movements and sudden spikes in trading volume. These fluctuations have attracted both short-term traders seeking quick gains and long-term investors drawn to the project's potential.
Technical Analysis
From a technical analysis standpoint, several key indicators suggest that Shiba Inu may be gearing up for a significant uptrend. One notable factor is the formation of bullish chart patterns, such as ascending triangles or bullish pennants, which often precede strong upward price movements. Additionally, the presence of higher lows and higher highs on the price chart indicates growing buying pressure and potential accumulation by investors.
Market Sentiment
Market sentiment also plays a crucial role in shaping the trajectory of Shiba Inu's price action. Positive news catalysts, such as listing announcements on major cryptocurrency exchanges or partnerships with established companies, can fuel optimism and trigger buying interest among traders. Moreover, the collective sentiment of the crypto community, as reflected in social media chatter and online forums, can serve as a leading indicator of future price movements.
Potential Catalysts
Several potential catalysts could propel Shiba Inu into a sustained bull run. The anticipated rollout of ShibaSwap, a decentralized exchange platform built on the Shiba Inu ecosystem, has generated excitement among supporters who view it as a game-changer for the project. Additionally, the integration of Shiba Inu as a means of payment by merchants and businesses could broaden its utility and foster adoption.
Risk Factors
Despite the bullish outlook, it's essential to acknowledge the inherent risks associated with investing in cryptocurrencies, including Shiba Inu. The crypto market is notoriously volatile, and prices can fluctuate dramatically in a short period. Regulatory uncertainty, market manipulation, and sudden shifts in investor sentiment are all factors that could impact Shiba Inu's price trajectory.
Conclusion
In conclusion, the chart dynamics of Shiba Inu suggest the potential for a massive bull run in the near future. With its strong community support, innovative ecosystem developments, and positive market sentiment, Shiba Inu is poised to capture the attention of both seasoned traders and newcomers to the crypto space. However, investors should exercise caution and conduct thorough research before making investment decisions, as the crypto market remains inherently unpredictable.
As always, it's essential to stay informed, stay vigilant, and approach investing in cryptocurrencies with a diversified portfolio and a long-term perspective.

SHIB UPDATE (3D TF)Before anything, pay attention to the time frame
What is clear is that SHIBA is inside the big wave B, which is a diametric wave.
The expectation is that wave G will sweep the lower liquidity pool and reach its Fibo support and then enter the big wave C.
The time frame is big, these waves take time.
