Shib gots some things going for it!?So Elliott wave style, could have been an extended W5 which would explain the pivot, wave 2 of the expanded wave and the potential termination point of the previous W4. Its in the area MO. And is a most likey target for a retrace based off of the Guideline of Depth of Corrective Waves. Some more good is that some EMAs are starting to cradle the PA and got a bit of Divergence on one of the indicators... would have like some nice Div on the RSI though... Not going to get excited until some volume comes in and the PA begins to look like the path on the chart. So alarms set!! Cheers.
Shibusd

SHIB/USD: Speculative Punches Capable of Violent ResultsSHIB/USD continues to deliver violent trading results for speculators who crave aggressive moves within the cryptocurrency world. Shiba Inu was trading at all-time highs in late October at nearly 0.00008800, but on the 20th of December the value of the cryptocurrency was approximately 0.00002850. This price is nearly a 68% decline in value.
The drop in value of SHIB/USD is extraordinary and for traders lucky enough to have been skeptical of the higher values of the cryptocurrency, this may have produced profitable selling positions. However, traders who were caught up in the fanfare of the positive result of October’s bullish climb, and bought in at the highs have likely suffered astonishing losses. Here’s the thing, SHIB/USD remains a pure speculative bet.
Traders who want to wager on the direction of SHIB/USD may be able to look at technical data and correlate it to broad market sentiment in the cryptocurrency world, but the results of Shiba Inu remain a sphere for speculators who understand the risks, all others should watch from afar. SHIB/USD is fractionally traded and the use of conservative leverage is appropriate because if a volatile move occurs, and it likely will, the results can be rather nervous when direction is not going in the intended manner.
Intriguingly, SHIB/USD is correlating to the major cryptocurrencies rather well. It could be said that Shiba Inu is a solid barometer of speculative sentiment within the cryptocurrencies. Having touched a low only one week ago, SHIB/USD has produced a solid gain upwards which may be making its buyers content. However, the current price value of SHIB/USD is now bouncing along important resistance levels and challenging values not seen since early December. Optimistic traders may see this as an opportunity to buy SHIB/USD and anticipate another leg up.
Speculators who are skeptical of the sudden upturn the past week and believe the results are a holiday bounce that will vanish could become sellers. Whether you are a buyer or a seller of SHIB/USD, risk management is essential, as this is a wager on broad cryptocurrency market sentiment in many regards. Choppy conditions may persist short term. If current resistance levels are broken higher, SHIB/USD could produce short term positive movement. Traders should to use entry orders to get appropriate price fills and use stop loss and take profit positions at all times if they are short term bettors.
Shiba Inu Coin Short-Term Outlook
Current Resistance: 0.00003875
Current Support: 0.00003770
High Target: 0.00003950
Low Target: 0.00003630

SHIB/USD - Downtrend ended. Pump next?SHIB has successfully left the downtrend channel in anticipation of a big move.
Key Support level: $0.000030; $0.000034
Key Resistance level: : $0.000038; $0.000047
SHIB has managed to exit the downtrend, and the price is currently moving sideways. The resistance at $0.000038 has so far stopped SHIB from going higher. The current support is found at $0.000034, and SHIB could continue moving sideways until a breakout takes place.
Technical Indicators
Trading Volume: The volume has increased ever since SHIB bounced off the $0.000030 support level. Interest in SHIB is growing, which is positive news for bulls.
RSI: The RSI on the daily failed to make a higher high on this last rally, but as of yet, it’s hard to categorize this as a bearish development.
MACD: The daily MACD remains bullish, but the histogram lost some of the momentum in the past few days. This is to be expected as SHIB is consolidating under resistance. If momentum fades more, then the cryptocurrency could retest the key support again.
Bias
The bias on SHIB is bullish. Even if there is a pullback, that would likely be a healthy move before it explores higher levels.
Short-Term Prediction for SHIB Price
If SHIB is successful in breaking above the current resistance at $0.000038, then the price can rally to $0.000047, which is the next key level to watch for. If that fails, then a pullback becomes very likely to the key support at $0.000034 before another attempt is made to move higher.

SHIB Breakout of Falling WedgeNice breakout of the falling wedge by SHIB. If you switch to the 15m chart you'll see a clearer picture of another bull flag formation at the breakout. A lot of consolidation opportunities for people to buy. I'm liking the prospects going into the New Year. Remember, only invest what you're comfortable losing. This is a high risk, high reward trade. Stay safe and hope everyone has had a good holiday.

SHIB bounced from the strong supportIf you didn`t entered at the retracement and strong support of 0.00003000:
Or before the pump, at 0.00000684:
then you should know that SHIB is heading to the 0.00004300 resistance.
Looking forward to read your opinion about it.

SHIBA Price has formed an "ASCENDING TRIANGLE" . I expect price to break the triangle to the up-side, indicating a continuation of the uptrend.


Shiba INU next move, Dec 24Wait for breakout confirmation
Consider Bitcoin / Total before doing anything also use stop loss

SHIBAFollowing Shiba's previous analysis, it seems that we have a new growth step (but not as much as the previous growth power) for Shiba.

Freeway to the MoonHello friends,
A Possible scenario is shown in the chart.
As you see, this pattern is a Bull flag. There are a few indicators that can be used. look for high volume at the breakout.
Also, you can confirm your entry with a closing price above the red line.

Get yourself a Shiba for ChristmasSHIBA in the middle of a 37% gainer. Still 22% left to gain by Christmas.

SHIBA HOLDERS EARNING 25% UPSWING Shiba Inu price experienced a bullish onslaught over the last two days, resulting in an exponential upswing. The run-up, while impressive, failed to collect liquidity resting above a crucial level. Therefore, investors can expect SHIB to retrace briefly before seeing another leg-up.
Shiba Inu price looks ready for more gains


SHIBA Inu possible bullish scenarioSHIB is on an important support and bounced very well.
In case of breaking out of the resistance at 0.00003711 it can hit the next targets:
0.00004878
0.00006959
0.00012424
On bearish scenario supports are 0.00002470 and 0.00002060

No matter how you slice this one it ain't lookin goodI see this heading down to the .00002 range before we get any relief. After that we'll have to see but for the time being it's not looking good. I think the tether issue has yet to fully unfold and may threaten crypto throughout Q1 if not longer.

SHIBA | Wedge Upside Breakout expected..!!
#SHIBA (Update)
Since 27th OCT Swing High, Shiba has been Consolidating in Falling Wedge Pattern..
Volume has been Continuously Descending From last 2 Months.
Now, Bulls Looking Strong & Expecting Massive Breakout But Still Bulls Need Strong Volume for it.
In case of Wedge Upside Breakout, Midterm Target Would be 0.000070 (2x ROI From Here)
📍 Always Wait for Confirmed Breakout & Candle to Close and Only then ENTER..
Please like the idea for Support & Subscribe for More ideas like this and share your ideas and charts in Comments Section..!!
Thanks for Your Love & Support..!!
SHIBUSDT trade update
SHIBUSDT trade hit overall 1501% profit. Now trade is at first supporting area as shown by yellow area as accumulation period. Final entry for buy position will be between 38% -23% fib level. To avoid FOMO situation, we have taken position around first defense area. So far trade is running according to our respected analysis. For good investment take position around 23% fib level. Trade will boost up as it crosses final resistance which will break accumulation period as shown in the graph. Our potential target will be 500% profit.
We publish precise and compact information which give you quick glimpse for comparative analysis. if you have any question or want to ask about analysis of other pairs or you have any confusion about analysis then feel free to ask us. Don't forget to support by share your ideas and hit like and subscribe button.

SHIB - potentially good trade setupSHIB after huge pump (1200%) is in downwards corrective movement.
Price has fall to last support area and it might keep inside this accumulation area for some time (until some better time for alts and meme coins - hype time).
At the moment I don't own any SHIB, but I'm looking to add if it breaks 21 D MA (black line), which will also mean breaking from falling wedge. There is no any bullish divergences on higher time frames.
I set alert if it pump not to miss it. Risk/reward ratio on this trade is good for me, TP 1 and TP2 is where I plan exit my initial investment + 10-20% gain and leave rest of it for potential strong upside move.
Don't be surprised if we stay in this accumulation region for some time or even dive under it.
Until bullish sentiment returns alts, and specially meme coins probable won't move significantly.

SHIB strong SupportIf you haven`t bought the dip, at 0.00000680:
www.tradingview.com
then you should know that SHIB is sitting at a strong support right now and looks ready for a bounce.
Looking forward to read your opinion about it.

Let sleeping dogs lieAs a followup to my last two posts where I warned FTX:SHIBUSD was following a classic bubble/bust pattern the target has been reached on my short from the Kraken release hype. That was the last gasp. Now Shiba is the first of many cryptocurrencies to break the all important December 4th US Jobs Report Liquidation Low. I do not expect the bleeding to stop here. I am targeting a full mean reversion over the next few months to 0.0001 territory.

shibusdtHello friends, today we are going to look at Sheiba's currency. Well, if you notice, Sheiba has reached a support area and we expect it to grow, but if it wants to lose its support, to low support.

SHIBUSDT | The best place to buy 🏹Hello traders, SHIBUSDT in daily timeframe , As you can see in the analysis, the first wave 2 and 2 are completed in our opinion and now wave 3 is forming.
Wave 3 structure is at the beginning of its process and from this structure, microwave 1 is completed and microwave 2 is formed.
Let's look at microwave 2:
In most cases, wave 2 is formed in a fast and more zigzag-like state.
We assume that wave 2 is zigzag because at the beginning of this wave a five wave is formed which corresponds to wave a .
So wave a has been completed since wave 2, and now we are probably inside wave b , wave b in the form of a flat and a plate that has no rules, and from this flat we think of an ascending wave in the shape of five waves to complete. Wants to be.
We consider the maximum ascent to be 0.618 points. In case of further ascent, this wave count should be corrected.
To confirm this ascent, the upward red circle is considered to be broken.
And in case of breaking the price 00003, the decline from the same range has been confirmed.
🙏If you have an idea that helps me provide a better analysis, I will be happy to write in the comments🙏
❤️Please, support this idea with a like and comment!❤️

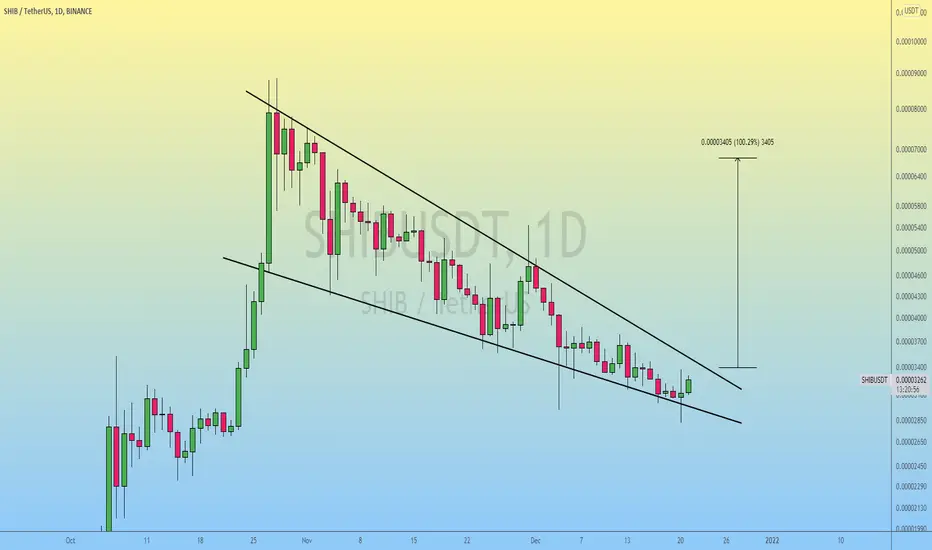
shib breakout incoming50% shib breakout incoming watch this channel to see if its a leg for the next fall or a reversal.
