SHIB May Be Gearing up for Something Big as Is ConsolidatesBINANCE:SHIBUSDT has consolidated between $0.00002794 and $0.00003102 over the past 24 hours. Traders and investors will want to see in which direction the memecoin breaks out of this range to try and gauge the crypto’s next move.
A 4-hour candle close above $0.00003102 could lead to the crypto entering into a bullish move. As such, the Shiba Inu price may attempt a challenge at the $0.00003607 resistance level in the following 24 hours. Thereafter, continued buy pressure could boost SHIB to as high as $0.00004382 in the short term.Conversely, falling below $0.00002794 may put the Shiba inu price at risk of correcting to the subsequent support level at $0.00001910 in the following 24-48 hours.
Technicals Still Flagging Bearish
Technical indicators on SHIB’s 4-hour chart suggest the Shiba Inu price may drop in the next 24 hours. Both the Moving Average Convergence Divergence (MACD) and the Relative Strength Index (RSI) are flagging bearish.
The MACD is positioned below the MACD Signal line, which is generally seen as a sign that a crypto is in a negative cycle. Similarly, the RSI is positioned below its Simple Moving Average (SMA) line. This could indicate that sellers are currently stronger than buyers on the short-term timeframe.
Traders may want to keep an eye on the MACD indicator, as the MACD Histogram is becoming more positive. This could be the early sign of a bullish trend reversal. In addition to this, the RSI shows that SHIB is currently oversold, which may be seen as a buy signal in the coming 24 hours.
For Shiba Inu (SHIB), based on the consolidation range and the technical indicators you've described, we can outline trading strategies for both bullish and bearish scenarios. Here, the focus will also be on identifying clear entry and exit points, along with managing risks effectively.
Potential Trade Strategies for the Shiba Inu Price
Long Position Strategy
Entry Conditions:
- Primary Entry Signal: A 4-hour candle closing above the $0.00003102 level, suggesting a breakout to the upside. This could be a signal for the start of a bullish move.
- Secondary Entry Signal: Look for bullish signals from the MACD, such as the MACD line crossing above the signal line, or the MACD Histogram showing increasing positive momentum. Additionally, consider the RSI moving out of the oversold territory as another entry confirmation.
Exit Conditions:
- Take Profit: Set the first take profit target at the next resistance level of $0.00003607. If the momentum continues, consider extending the take profit to $0.00004382, monitoring closely for any signs of reversal.
- Stop Loss: To manage the risk, set a stop loss just below the consolidation range, around $0.00002790, to minimize potential losses if the market moves against your position.
Risk Management:
- Pay attention to the volume supporting the breakout, as increasing volume can validate the move.
- Adjust your position size to ensure that the maximum loss does not exceed a small percentage of your trading capital.
Short Position Strategy
Entry Conditions:
- Primary Entry Signal: A 4-hour candle closing below the $0.00002794 support level, indicating a potential bearish breakout from the consolidation range.
- Secondary Entry Signal: The MACD remaining below the signal line combined with the RSI remaining below its SMA line can serve as confirmation that the bearish momentum is likely to continue.
Exit Conditions:
- Take Profit: The initial take profit target can be set at the subsequent support level of $0.00001910, as a fall below the consolidation range could lead to significant downside.
- Stop Loss: Place a stop loss slightly above the consolidation range, around $0.00002800, to protect against the possibility of a false breakout or sudden reversal.
Risk Management:
- Monitor the MACD Histogram for signs of diminishing negative momentum, which could indicate a weakening of the bearish trend.
- Consider the overall market sentiment and any external factors that could influence the price of SHIB, adjusting your strategy accordingly.
General Tips:
- Always review the risk-reward ratio to ensure that potential rewards justify the risks.
- Be prepared to exit positions if the market shows signs of a reversal that contradicts your initial analysis.
- Keep an eye on broader market trends and news that could impact the cryptocurrency market, as memecoins like SHIB can be particularly sensitive to social media trends and broader market sentiment.
- Consider using trailing stops in profitable positions to capture gains while protecting against sudden market reversals.
Given the bearish indicators but also the potential for a reversal indicated by the MACD Histogram and the oversold RSI, it's crucial to wait for clear signals before entering trades and to manage risks carefully.
SHIBUSDT

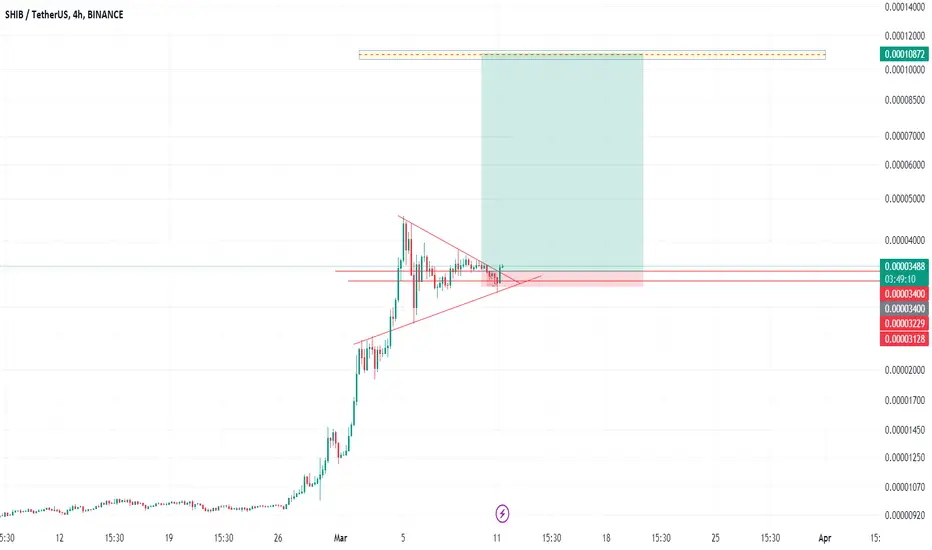
Shiba Inu Crypto: Riding the Wave of VolatilityThe world of cryptocurrency has always been a rollercoaster ride, and Shiba Inu (SHIB) is no exception. Over the past few weeks, SHIB holders have experienced a whirlwind of emotions as the price soared by a staggering 370% from its recent lows. Now, as the price consolidates tightly on the higher short-term support side, investors find themselves on the edge of their seats, eagerly awaiting the next move.
At the heart of this excitement is the formation of what appears to be a bullish bull pennant. This technical pattern is characterized by a consolidation phase following a significant price increase, forming a triangular shape resembling a pennant on a flagpole. In the case of Shiba Inu, this consolidation is occurring at higher levels, indicating strong support and a potential continuation of the upward trend.
However, while the chart may suggest a bullish bias, there's a crucial piece of the puzzle missing: volume. Volume is the lifeblood of any market, providing valuable insight into the strength and sustainability of price movements. In the case of SHIB, the current consolidation phase is accompanied by relatively low trading volume, leaving investors in a state of uncertainty.
Without sufficient volume to confirm the direction of the breakout, traders are left in a precarious position. Will SHIB break out to new highs, propelled by renewed buying interest and investor enthusiasm? Or will it succumb to selling pressure, triggering a downward spiral and erasing recent gains?
For now, the answer remains elusive, and investors must exercise caution. While the temptation to jump in and capitalize on potential gains is strong, it's essential to approach the market with a level head and a clear strategy. Risk management is paramount, especially in the face of uncertainty.
As someone currently holding a position in SHIB, the stakes are high. Watching closely for any signs of a breakout, whether to the upside or downside, is crucial. Setting stop-loss orders and defining profit targets can help mitigate risk and protect capital in the event of unexpected price movements.
Beyond the short-term speculation, it's essential to consider the broader fundamentals of Shiba Inu and its ecosystem. Launched as a playful experiment in decentralized community building, SHIB has captured the imagination of crypto enthusiasts worldwide. With its vibrant community, meme-inspired branding, and ambitious roadmap, SHIB has carved out a niche in the ever-expanding world of cryptocurrencies.
Yet, amidst the hype and excitement, it's essential to maintain a balanced perspective. Cryptocurrency markets are notoriously volatile and unpredictable, with fortunes made and lost in the blink of an eye. While the allure of quick gains may be tempting, it's crucial to approach investments in SHIB, or any other cryptocurrency, with caution and diligence.
In conclusion, the current consolidation phase of Shiba Inu presents both opportunities and risks for investors. With the potential for a bullish breakout on the horizon, accompanied by the uncertainty of low trading volume, careful observation and risk management are paramount. As the crypto community eagerly awaits the next move, one thing remains certain: the journey of Shiba Inu is far from over.

Shiba Inu Shib price is preparing for a powerful "pump"? Looking at the global chart of ShibUsdt, the first thing that catches your eye is that the price is now in a strong liquidity zone.
It was in the price range of $0.00000600-0.00000800 that a long position was "gained" in 2021 before the start of the bull run.
The second thing that catches your eye is that now the consolidation pattern is visually very similar to the one that was at the final stage of consolidation in 2021 before the start of "the pump".
Since it is not known for sure how much longer the consolidation of the Shiba Inu token price will last, and whether there will be "a pump" afterwards, we do not risk buying such a manipulative tool as Shib now.
However, when and if the price of ShibUsd is firmly established above $0.00000830, we can consider buying Shib to participate in at least +50-60% of "the price pump".
_____________________
Did you like our analysis? Leave a comment, like, and follow to get more

ShibUsdt BinanceMarch 21st shib will reveal itself, until then sideways.
Pure speculation, no trading advice.

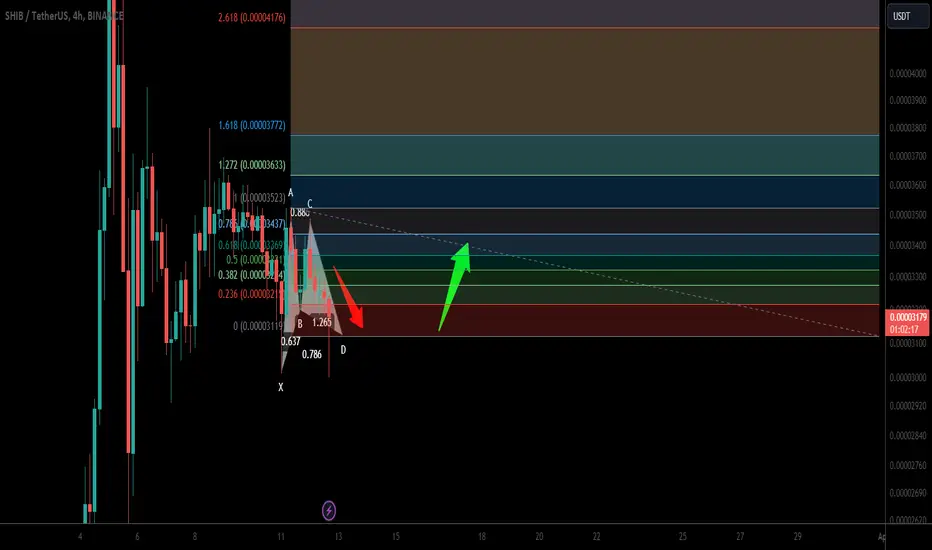
SHIBA INU (SHIB) completed a setup for upto 14% pumpHi dear friends, hope you are well, and welcome to the new update on SHIBA INU (SHIB) token with US Dollar pair.
In the previous trade setup SHIB was very close to enter the buying zone, but pumped without entering the buying zone as below:
Now on 4-hr time frame, SHIB has formed a bullish Gartley move for the next price reversal.
Note: Above idea is for educational purpose only. It is advised to diversify and strictly follow the stop loss, and don't get stuck with trade.
Shiba Inu Fun play- it's been long time that i didn't post about Meme coins.
- They are good to gamble a bit, make u feel like u go to casino to spend few hundreds bucks for fun and relax.
- They are mostly dependents on announces, Burn!!, new partner!, and more fancy tweets.
- Right now we are on a little bit boring period, as BTC will mostly sideway for a while.
- Most of altcoins dipped -90%-95% so it's a good time for play without much efforts.
-------------------------------------------------------------------------
- Here a simple trading plan (i took out the 0.000000xx$ :D)
-------------------------------------------------------------------------
Buy The Dip (2021 support) : 8000-7000ish
Buy The Pump (at liquidity Zone) : 10,000ish+
-------------------------------------------------------------------------
Sell Zone : 15,000-17,000 (don't fall in love)
-------------------------------------------------------------------------
SL : 5000 ( Don't play fire with Meme Coins ).
-------------------------------------------------------------------------
Happy Tr4Ding !

SHIBMANIA - Over 700% Gain From Our Last Analysis! ✅In our last analysis, we made everyone aware that SHIB was getting ready to explode.
Safe to say that we sure did explode, with over 700% gained! We'll be targeting 0.00008 and then seeing how far we can go with this.
Hope you guys managed to make some gains!
Goodluck and as always, trade safe!
See your previous analysis below

another 200% is on wayHello
I decided to put some 4h analyses for you but those give you quick profits.
Shiba Potential Upward Move in the Works? (UPDATE) CRYPTO:SHIBUSD : Potential Upward Move in the Works?
This update focuses on the potential price movement of Shiba (SHIBUSDT) in the next 24 hours. After a period of consolidation, the SHIB/USDT chart suggests a possible movement to the upside.
Why This Might Happen?!
Bitcoin Momentum: The recent rises in Bitcoin's price often influences the broader market, including meme like Shiba.
Increased Trading Activity: Growing transaction volume and market capitalization across the cryptocurrency space could fuel a more intense and rapid upward movement for SHIB.
Important Note: This is just an analysis, and future price movements are never guaranteed. It's crucial to do your own research before making any trading decisions.
Good luck!
SHIB BREAKOUT IN 1H TIME FRAMEShiba Inu is trending in Triangle in 1h timeframe, which might breakout soon, you can go for a long position.
Entry point is given in chart
Targets : 0.000038, 0.000040, 0.000042
(Spot and low leverage trade)

SHIB/USDT A successful Break the supply, Indicating Continue UP💎 SHIBA has recently exhibited significant market dynamics. Currently, it is encountering resistance at the supply area, with the previous attempt to breach it at 0.00388 resulting in rejection.
💎 If SHIBA manages to successfully break above this supply area, confirmed by a daily candle closing above it, there is probability for SHIBA to continue its upward movement and reach our target area.
💎 However, if SHIBA fails to break out above the supply area, there is a likelihood of price rejection and a subsequent decline towards the demand area. Notably, SHIBA has yet to retest the demand area after its significant breakout in the past.
💎 The demand area holds crucial significance for SHIBA, as a bounce from this level would signify strength and an attempt to re-challenge the supply area.
💎 However, failure to sustain above the demand area, resulting in a breakdown, would signal a bearish sentiment. This could lead SHIBA to revert to a bearish trend, potentially prompting further downward movement towards the support area, or even lower levels.

SHIB (Shiba Inu) Technical Analysis#SHIB has decisively broken out of its extended sideways consolidation, signaling a strong bullish shift. This analysis examines how to capitalize on this momentum by employing price action strategies in the context of the current range breakout. We'll focus on reading price action to identify opportune entry points. Be mindful of expected volatility, and prioritize rigorous risk management practices.
Disclaimer: This analysis serves as a technical perspective and should not be interpreted as direct financial advice. Cryptocurrencies carry inherent risks. Always seek guidance from a qualified financial professional and thoroughly assess your individual risk profile before any investment decisions.

"Let's be realistic with SHIB" - Is 2400% realistic enough ?#SHIB/USDT #Analysis
Description
---------------------------------------------------------------
+ SHIB is currently looking to breakout from its resistance zone
+ I see a clear bullish divergence with the RSI and price. Overall SHIB is showing a bullish signs
+ For the long term trade, i'm planning to enter a position at the current price.
---------------------------------------------------------------
VectorAlgo Trade Details
------------------------------
Entry Price: 0.00001133
Stop Loss: 0.00000767
------------------------------
Target 1: 0.00001371
Target 2: 0.00001601
Target 3: 0.00001956
Target 4: 0.00002466
Target 5: 0.00002976
Target 6: 0.00003944
------------------------------
Timeframe:1W
Capital: 1-2% of trading capital
Leverage: 3-7x
---------------------------------------------------------------
Enhance, Trade, Grow
---------------------------------------------------------------
Feel free to share your thoughts and insights.
Don't forget to like and follow us for more trading ideas and discussions.
Best Regards,
VectorAlgo

SHIBUSDT | 1-2-3 Wave projection - Pullback Position +75%A possible pullback for a long position at the key falling wedge breakout the price also now at the key weekly support EMA50W with bullish pinbar.
If successfully takes out the previous high at fibonacci 100% extension, the next target 1-2-3 pattern at 161.8% and 261.8% level +75% and +130%+
weekly MACD: doubled bullish divergence at the pivot point, golden crossed and above baseline supporting the uptrend continuation when retesting the baseline.

SHIBA INU UPDATEIn this video i will be explaining my idea for shiba inu token
Please like and share if you found this video helpful
Thanks for watching!

SHIB: scalp in M15📊Analysis by AhmadArz:
🔍Entry: 3645
🛑Stop Loss: 3437
🎯Take Profit: 3955-4216-4455
🔗"Uncover new opportunities in the world of cryptocurrencies with AhmadArz.
💡Join us on TradingView and expand your investment knowledge with our five years of experience in financial markets."
🚀Please boost and💬 comment to share your thoughts with us!

Alikze → SHIB | Completing ascending micro waves 3According to the analysis of the previous post, it climbed to the supply area after the exit of the density. In the 12h time, after the support in the green box area, it is completing the 2 out of 3 microwaves. This current wave, with the support of the green box, has the ability to reach the supply area, and then the 0.78 Fibo target, and then the 0.00001401 target. had
Note: Note that there is a double correction in the weekly time that has been completed and is in ascending guard, which I will send step by step updates.
Analysis invalidity: below the green box area
🟩Sup:Green box
⛳️Tp 1:0.00001060 - 0.00001089
⛳️ Tp2 :0.00001178
⛳️ Tp3 :0.00001401
------------------
Please support this idea with a LIKE and COMMENT if you find it useful and Click "Follow" on our profile if you'd like these trade ideas delivered straight to your email in the future.
Thanks for your continued support.
Sincerely.❤️

SHIB has a very good Investment opportunity Hi Everyone;
today we have a memes coin
it has more than 187 times the risk and the chart is look very promising.
I expect breaking the previous bear market key point will clear the way to the final target
I don't recommend investing too much money in memes coins because of the High volatility.

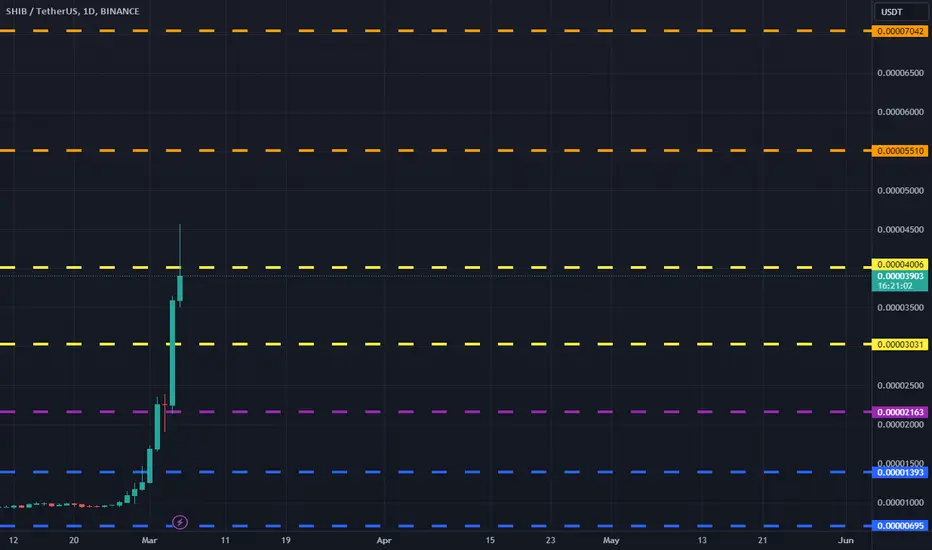
SHIBUSDT(Shiba Inu) Daily tf Range Updated till 05-03-24SHIBUSDT(Shiba Inu) Daily timeframe range. it had insane amount of continuous pump. outperforming many things at once. easiest profit one can made. now trying against 0.00004006 a retrace would not surprise me at this point but it still have enough fuel do more carnage.
Shiba/USDT Up to 20% profit waiting for new buyersThe attention of all users has been drawn to Shiba. According to the numerical patterns in the chart, I think we will grow by 20%. If this does not happen, I will shave my hair and post the video here

Shib Charting from Oct 2021This has to be the most detailed chart I have done. I’m just sharing the chart in hopes someone finds some value in it.

MEMECOINS TO THE MOON ?! 0.0005$ FLOKIUSDT COMING !!!Hi Guys!
Before starting the analysis, I want to say two things
First of all , because I am not a premium user, I have to analyze in higher time frames , which of course has a lower percentage of errors , but it is more difficult to understand!
Second , I personally am not interested in meme coins and I don't think they are very predictable based on the price chart.
Well, to predict the price behavior of BINANCE:FLOKIUSDT and most of these meme coins
I think the first point is to wait until the weekly candle closes and make your decision then .
The first scenario is that the price will break the specified resistance area in the range of 0.00004 to 0.000045 with power and momentum, and the next candle will open completely above the broken resistance.
In this case, for a low-risk buy position, we wait for a pullback at the broken Resistance and make our Buy there. In this case, our Stop loss will be activated below the broken resistance.
The second scenario assumes that the upward trend of the market will be maintained, especially for Bitcoin . If the price is rejected from the specified resistance and returns to the previously broken trend line, in this case, the low-risk buy position is at the pullback point to the broken trend , and in this case, the stop loss is activated at a price of 0.000015 to 0.00002.
And The price targets are specified in the chart as follows
Short-term TP
0.00007
Mid-term TP
0.00011 / 0.00022
Long-term TP
0.00030
And in case of parabolic price movement, maybe up to 50 times prices (very, very low probability)

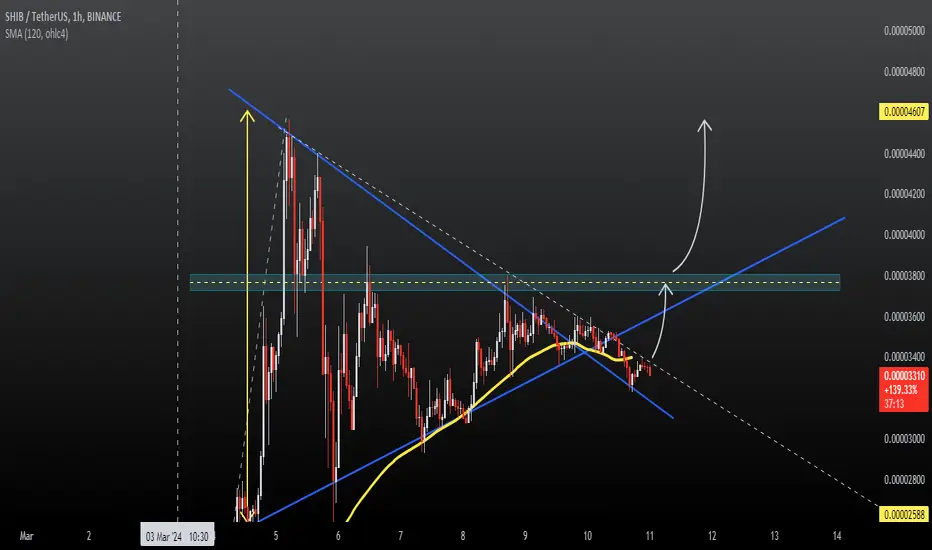
Shiba Inu Technical Analysis: Consolidation or Breakout?Current Situation:
Shiba Inu has entered an accumulation zone, indicating a period of consolidation where buyers and sellers are reaching an equilibrium.
Despite facing resistance just above this zone, Shiba has managed to regain some of its strength.
The price is currently hovering around its 10-day moving average, a key technical indicator.
Potential Moves:
Breaking above the Trendline (TT Line): This could lead to a downward channel breakout, potentially lowering the price range. ⬇️
Breaking above the MACD Signal Line (Green Line): This could signal a bullish breakout, leading to a potential price increase. ⬆️
Breaking below the RSI Support Line (Blue Line): This could indicate a loss of momentum, potentially leading to a price decline. ⬇️
Additional Observations:
Rising Trading Volume: The recent increase in trading volume suggests heightened volatility in the near future.
Potential for Uptrend: Based on the rising volume, there's a chance for Shiba to climb toward the next weekly resistance level if it moves.
Overall:
From a technical analysis standpoint, Shiba Inu is currently in a consolidation phase. The direction of the price will depend on whether it breaks above or below key technical levels like the TT Line, MACD Signal Line, and RSI Support Line. The increased trading volume suggests a potential for significant price movement in the coming days.
This analysis is for informational purposes only and should not be considered investment advice. Please conduct your own due diligence before making any investment decisions
