Navigating the Waves: A SHIB AnalysisThe dynamic world of cryptocurrency is full of surprises and SHIBA INU (SHIB) is no exception. Looking at the one-hour time frame chart, the zero Fibonacci level stands at 0.00000700. When shifting our view to the four-hour time frame, Fibonacci level of 1.618 reads 0.00000726, followed by the 2.618 level at 0.00000777. This higher Fibonacci level appears to present a firm resistance point.
With the Bollinger Bands, the upper limit is at 0.00000747, the middle at 0.00000709, and the lower boundary at 0.00000671. The stochastic oscillator and RSI sit at 79 and 76 respectively, suggesting a potentially overbought market. The On Balance Volume (OBV) stands at a staggering 316 trillion, while the Moving Average Convergence Divergence (MACD) clocks in at 0.00000613. At the time of this analysis, SHIBA INU trades at 0.00000742, reflecting a 24-hour price change of approximately 8%.
Looking at these indicators, the short-term outlook for SHIBA INU (SHIB) seems bullish. The market price surpassing the middle Bollinger Band and a robust OBV suggest a strong buying pressure. However, the high RSI warns of an overbought market and a potential pullback.
Even though such conditions often lead to a minor price drop, this is generally a natural part of a bullish trend and doesn't necessarily signal a market downturn. Nevertheless, given the inherent volatility of cryptocurrencies, this interpretation is based on current data and might change with incoming market news, major financial events, or changes in market sentiment.
Crypto trading is as much about risk management as it is about seizing opportunities. The market can remain irrational longer than a trader can stay solvent. Consistent profitability isn't about making the right call on every single trade; instead, it’s about making informed decisions over time. As traders, we must stay vigilant, keep adjusting our strategies according to market behavior, and always trade responsibly.
SHIBUSDT

shiba shibusdt Hello friends, I hope you always win in the market. This is a long-term analysis of SHIBUSDT currency. I believe that this currency is undergoing a deep correction. However, my words are focused on other exchanges, which have more history than this currency. There are, and in my opinion, the time of purchase is 25% to 25% at specified points, in any case, be careful of market movements.

SHIBUSDT - and the level for 2h.Hello everyone. There will be a short review for the short term on SHIBUSDT. A small number of coins formed about the same pattern as SHIBUSDT has now, namely: the coin does not update its minimum values, has split the level three times and now approaches it more confidently. Which is very similar to the imminent breakdown of the level and a hike to 0.00000781.

SHIB Shiba Inu Whales are Selling !If you haven`t bought SHIB here:
Or sold it here:
Then you should know that another notable transaction was reported on June 9 by Blockchain tracker Whale Alert, involving the transfer of 4 trillion Shiba Inu tokens to Binance. This transfer, worth $31.7 million, incurred a minimal fee of only $1.78 before the price of Shiba Inu experienced a decline.
Following the transaction, there have been various reactions from market participants, with some highlighting that it resulted in a 1% increase in Shiba Inu's circulating supply to 578.9 trillion tokens. It appears that whales are engaging in selling activities.
My price Target for SHIB is $0.00000500.
Looking forward to read your opinion about it!

SHIBUSDTWell, as soon as he sees that the price has broken the triangle and is pulling back.
But this broken is not a normal market failure.
So you can give Stophunt a chance.
The price paths are clear.
I myself buy a weekly candle in Polbek Buy at the high price of 86,559 when it was closed.

Shib is going to reach 45~32 ZONE easily !it can reach 95 zone before it reach the 32 zone OR directly touch 45 zone
in my idea due to market condition and news we can have 45 ZONE sooner than you think on the table .
There is no way out for most of crypto currencies to get their ATH(even half of it) back less than 2024
DYOR

SHIB Continues Downward TrendDue to the continued selling pressure in the market, SHIB continued its downward trend within a specific range. This trend persisted even after breaking the bottom of the channel, eventually reaching its lowest historical range at the price of 0.0000055 to 0.0000060 dollars. It is worth noting that this range served as the bottom of a channel range in 2020, where Shiba experienced remarkable growth of over 1000% due to increased demand within that range.
However, the recent price action has brought about significant developments. The level between $0.0000070 and $0.0000078, which was a previously strong support, was broken by a strong bearish candle. As a result, this level has now turned into a resistance. If the price reaches this range, a negative reaction is expected.
Furthermore, there was a notable 20% reaction within the support range mentioned earlier. This indicates that both the power of buyers and sellers were substantial, suggesting the potential formation of a range channel between the considered levels. The RSI level, currently at 19, further supports the negative sentiment surrounding SHIB. An RSI value below 30 indicates oversold conditions, suggesting that SHIB may be undervalued and due for a potential price correction or reversal.
Therefore, while the possibility of a price rebound or shift in sentiment exists, as oversold conditions can sometimes lead to buying interest and subsequent recovery, it is important to note that the overall trend remains negative. There has been no observed change in the trend to an upward mode, and the momentum remains decidedly negative.

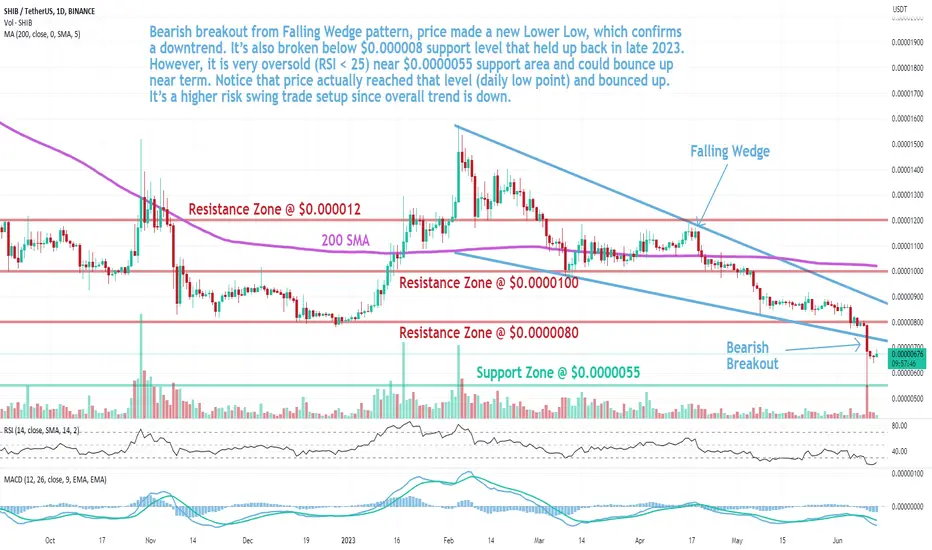
SHIB: Falling Wedge BreakoutShiba Inu (SHIB) technical analysis:
Trade setup : Bearish breakout from Falling Wedge pattern, price made a new Lower Low, which confirms a downtrend. It’s also broken below $0.000008 support level that held up back in late 2023. However, it is very oversold (RSI < 25) near $0.0000055 support area and could bounce up near term. Notice that price actually reached that level (daily low point) and bounced up. It’s a higher risk swing trade setup since overall trend is down.
Trend : Downtrend across all time horizons (Short- Medium- and Long-Term).
Momentum is Bearish (MACD Line is below MACD Signal Line, and RSI is below 45).
Support and Resistance : Nearest Support Zone is $0.0000055. The nearest Resistance Zone is $0.0000080 (previous support), then $0.0000100, and $0.00001200.
shibThe trend is still bearish, in the first step, the price can look at this area as resistance and check the lower lines for buying.

ShibUSDT ready to go upAs we predicted one year ago, SHIBUSDT hit lowest level of our analytical prediction. Now it’s time to go up with little accumulation.

SHIBA more gain 🚀Hello 🐋
Based on the chart
the price is close to the major support and in the triangle pattern ✔️
beside
we expect to see gain and pump from here ✔️
and even
the range market and many range candlesticks are acceptable scenario too 📖💡🚀
👌 Notice: pay attention to the price on shortcut chart (located under the main chart with black colour) 📖💡
Please, feel free to share your point of view, write it in the comments below, thanks 🐋

SHIB is about to reach a recent low !SHIB is about to reach a recent low !
This figure shows the weekly candle level chart of SHIB from the beginning of 2022 to the present. The graph overlays the high points and their connections from the past year and a half, as well as the horizontal lines of the bullish starting positions after the end of mid June 2022! As shown in the figure, due to the negative news in recent days, SHIB has retreated to the key support level, which is below the long start level (0.000008030) after the end of mid June 2022! So, once the daily closing of SHIB is below this position for three consecutive trading days, the space below will open, and it is likely to hit a new low in the past year and a half!

Resistance Breakout Challenge and Downward Trend ReturnThe SHIB token has encountered difficulty in surpassing the resistance level in recent weeks, failing to achieve a decisive breakout above the $0.00000890 threshold. Ideally, a confirmation candle should have followed this breakthrough, but instead, a notably bearish candle emerged. Consequently, the overall downward trend of Shiba Inu has persisted, leading it back to the lower boundary of a short-term descending channel within the $0.00000780 range.
Maintaining support within the crucial $0.00000780-$0.00000700 range is of utmost significance for Shiba Inu, as successfully doing so could facilitate a robust recovery for the cryptocurrency. Presently, the price remains approximately 12% above the lowest point of this support range. However, a breach of this support level, as previously mentioned, would indicate an extended period of decline for Shiba Inu.
Should Shiba Inu demonstrate positive responses at its current support level, there is potential for growth following the establishment of a range-bound trend.

Shiba inu - SHIBHere is the support zone, but there is no signal to buy yet, the trend is still down, you need to wait for the TA reversal pattern and it is necessary that the priority increase to at least 70%

SHIBA is preparing itself to breakoutevery thing has been showed in pictured.we shoild just wait to happen.

JUST BUY IT WILL BE PUMPI promise you this process will be done
Channel floor support and one-third support
Just buy and enjoy the pump
follow meand enjoy analyse and take profit

Shiba Inu SHIB and the US Debt CeilingNegotiators from Democratic and Republican parties finalized an agreement on Sunday night.
Instead of raising the limit to a specific level, they have opted to suspend it entirely until 2025. This strategic move ensures that their bills can be paid until that date, while also guaranteeing that the next battle to raise the ceiling will not coincide with the upcoming presidential election.
The resolution of the debt ceiling issue brings optimism and stability to the financial landscape, which has a positive ripple effect on the cryptocurrency market.
Bitcoin and the broader crypto market stand to benefit from increased investor confidence, reinforced safe-haven status, enhanced institutional adoption, regulatory clarity, and the overall positive impact on global markets.
SHIB/USDT
Entry Range: $0.00000800 - 0.00000910
Price Target 1: $0.00000990
Price Target 2: $0.00001100
Price Target 3: $0.00001260
Stop Loss: $0.00000700

Could SHIBUSD outperform BTC after potential bounce back?Are you tired of hearing about Bitcoin's ups and downs? Let's talk about something more exciting - the SHIBA INU bounce back!
So why should you care? For starters, SHIBA INU has been making waves in the metaverse. That's right; there's a whole Shiba Inu universe out there waiting for you to explore. From NFTs to gaming, the possibilities are endless.
And let's not forget about the community. The Shiba Inu community is one of the most passionate and dedicated groups. They've even donated millions to various charities, including COVID-19 relief efforts.
So what are you waiting for? Don't miss out on the SHIBA INU hype train. Instead, join the community, explore the metaverse, and see why this little pup is giving Bitcoin a run for its money.

bullish on shibusdtThe bottom is in for shibusdt at 0.0000082, mega bullish on shib, next resistance at 0.0000097

✴️ Shiba Inu Higher Low In ProcessAfter a very strong bullish breakout in early 2023, from January through early February, Shiba Inu is now in the process of producing a higher low.
The correction has been going for more than 3 months (107 days) and we are seeing bullish action today.
There is a hidden bullish divergence with the RSI and this is all happening after a classic ABC EW correction.
These signals are pointing to a potential reversal.
More details on the chart.
Namaste.


