SHIB - Keep an eye on this level!Here's a quick look at the 8 hr . SHIB chart. As we can see, the price is getting closer to the trendline, and a break to the upside could be around the corner!
BTC is close to a more significant resistance zone (29k zone), and one should be careful when trading!
-------------------------------------------
The idea is: Buy when the price breaks above 0.0000112$ and take profits at the levels shown in the chart.
Targets:
1. 0.0000115$
2. 0.00001169$
3. 0.0000122$
4. 0.0000128$
-------------------------------------------
Key Dates to Watch in March:
22 Mar: FOMC Meeting
30 Mar: GDP Report
-------------------------------------------
If you like the content, then make sure to comment and like the post :D
Follow me for daily profitable trading setups.
BTC dictates the market. If BTC falls, then Alts will drop as well. Trade safe!
SHIBUSDT

🔥TAKE A CLOSER LOOK AT SHIB BEFORE IT GOES TO HIGHS🔥Hi, friends SHIB still doesn't show it's potential but I think the pump will begin very soon. Here is an entry point and 3 targets for SHIB.
📊 TRADING PLAN FOR SHIB:
1. squeeze to the trendline
2. buy orders on DOM and Footprint scalping tools which help to track the whales
3. bullish BTC or consolidation at least
🚩 BTC updates the highs, but altcoins close to its bottom. That's mean that alts accumulate the power to explode when BTC reach the local highs and start to consolidate there.
✅ THE MAIN TARGETS FOR SHIB:
🔥 $0.00012-125 - the value area and strong resistance
🔥 $0.00014 - the key level
🔥 $0.000175 - the key level and local high
I think that the local high will be the highest price only if Elon don't start to pump memecoins (DOGE, FLOKI, SHIB) again.
💻Friends, press the "boost"🚀 button, write comments, and share with your friends - it will be the best THANK YOU.
P.S. Personally, I open an entry if the price shows it according to my strategy.
Always do your analysis before making a trade.

SHIBUSDT likely to head down to weekly support around 0.00001026The price is trading below the daily support currently. Let us try a short here as it seems favorable and target the weekly support zone around 0.00001026.


SHIBA Weekly View - March 2023Hello Guys, Weekly Analysis is on the SHIBUSDT Symbol in a 1H Time frame, I Hope it Will be Useful for You, Don't Forget to Like, Follow, Comment

shibusdhey everyone...
shib is picking up from the support around 0.00001036... with shib coin burned this morning, we could see a bullish movement, making the coin jump to next resistance level of 0.00002014... in long run it is possible for shib to scratch more zero.. as the circulating supply decrease
high possibility for shib to be bullish in coming week as Eth is break the resistance trendline and reaching near 2000
good luck

SHIB - Keep an eye on this level! Here's a quick look at the 8 hr. SHIB chart. As we can see, the price is getting closer to the trendline, and a break to the upside could be around the corner!
BTC is close to a more significant resistance zone (28k zone), and one should be careful when trading!
-------------------------------------------
The idea is: Buy when the price breaks above 0.0000115$ and take profits at the levels shown in the chart.
Targets:
1. 0.00001169$
2. 0.0000122$
3. 0.0000128$
-------------------------------------------
Key Dates to Watch in March:
21/22 Mar: FOMC Meeting
30 Mar: GDP Report
-------------------------------------------
If you like the content, then make sure to comment and like the post :D
Follow me for daily profitable trading setups.
BTC dictates the market. If BTC falls, then Alts will drop as well. Trade safe!

✴️ Shiba Inu Back On The Green? Patience Is Key! Easy 70%The correction definitely ended 10-March but this market is taking its time to recover, why?
We are set to experience long-term growth.
Shiba Inu (SHIBUSDT) is set to grow for the long-term.
That's why it is taking its time to recover because the longer the consolidation phase, the stronger the growth that follows when it takes place.
✔️ We can see the downtrend from the early Feb. high already broke.
✔️ We can see prices trading above EMA10 and MA200.
✔️ And again, the classic MACD bullish cross.
Over 70% can happen easily and fast on the next jump... But prices can go much, much higher. Patience is key.
Thanks a lot for your continued support.
Namaste.

shibShib technical analysis:
Friends, the harmonic bullish pattern is marked with targets. This analysis is valid until I give a correction analysis of Bitcoin. This currency has not grown that much.
Good luck
Karim Heydari

shib new updateHi, dear traders. how are you ? Today we have a viewpoint to BUY/LONG the SHIB symbol.
For risk management, please don't forget stop loss and capital management
When we reach the first target, save some profit and then change the stop to entry
Comment if you have any questions
Thank You

SHIB IS BEARISHHi, dear traders. how are you ? Today we have a viewpoint to SELL/SHORT the SHIB symbol.
For risk management, please don't forget stop loss and capital management
When we reach the first target, save some profit and then change the stop to entry
Comment if you have any questions
Thank You

SHIBUSDT hitting weekly support, a long is favorable hereThe last trade was closed without profit and the price bounced and moved up as expected but remained a bit short of target. Now the price has fell again back to weekly support and a long is favorable here. For a bit better and conservative entry long it when price dips below the weekly support.

Possible Recovery of Bone Towards $1.66 Bone could recover towards 1.66 usd, performing the same head-shoulder pattern that it has been performing for the third time in recent months.

SHIBUSDTHello Crypto Lovers,
Mars Signals team wishes you high profits.
This is a one-day-time frame analysis for SHIBUSDT
R1 is the resistance area in this chart with its presentation of the disability of the price to rise at several points. R2 used to be a support area. And S1 is a support line at the bottom with its support of price at different points. Thus, the price had a recovery and a rising trend over S1 and now it is fluctuating below R1 area as you observe. We will wait for two options. Either a rise or a fall. Subsequently, we must wait for some confirmation candles to rise and an increase would be there for the price to reach R2 besides having more fixation over R1, more rise is expected. Also by giving us some falling signs and not being supported at its current point, more decline will definitely be waiting for the price toward lower amounts. You should know that those who tend not to have risky trades, we suggest them to put their purchase orders at R1 but it is okay for traders with a high risk intention to wait up to the time the price reaches R2.Note that for enjoying less risky trades, we recommend you to obtain every piece of information and details through our analyses and updates.
Warning: This is just a suggestion and we do not guarantee profits. We advise you to analyze the chart before opening any positions.
Wish you luck

SHIB looking Long...The last calls completely took me to hell. I try to warn every time that this is a spot trade and the market right now is completely unpredictable. However, granted the 2 month fall on SHIB and current levels, SHIB is looking pretty stable compared to most for the volatility. Spiritually this is a time of risks. I trade spiritual shifts as well. With this being said, technicals have none done much justice and forex has been hit or miss. Taking a leap on the beyond TA approac, although range is begging to pump. Will update as SHIB picks up movement a bit. Looking for that long green middle finger. Don't risk what you can't lose. Let me know your thoughts, but IMO this is bottom for SHIB.... we gonna have a nice bull this summer.

SHIBUSDT long from daily supportThe price hit the weekly resistance and pushed back. Currently it is heading towards daily resistance turned support zone. After the price hit that zone a long position will be favored.

Shibusdt Analysis Forming Descending Channel in h4 Timeframe Incase Of breakout Expecting Another Bullish Impulse
Expecting 30 to 35% Bullish Move

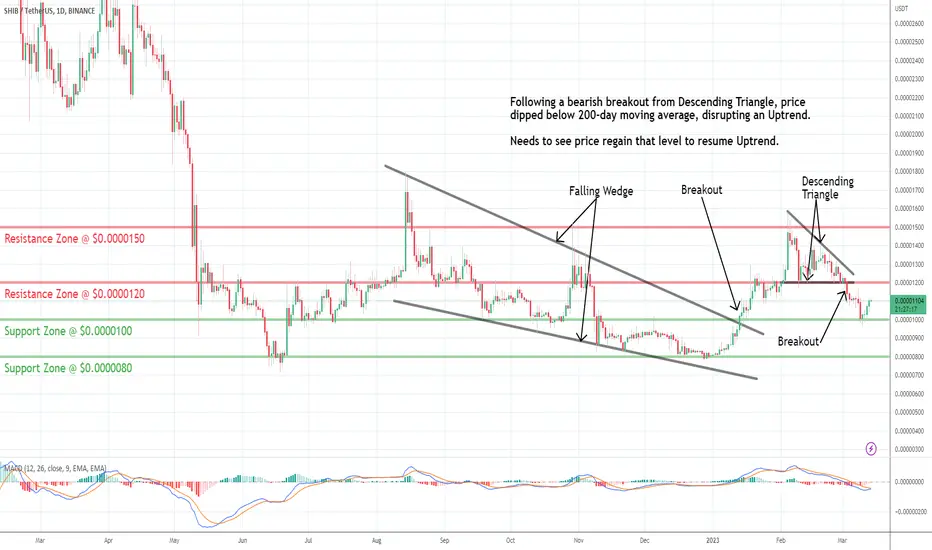
SHIB: Approaching ResistanceShiba Inu (SHIB) technical analysis:
Trade setup : Following a bearish breakout from Descending Triangle price dipped below 200-day moving average. Trends are mixed now. Price needs to regain that 200-day MA and $0.000012 levels to resume Uptrend.
Trend : Downtrend on Short- and Medium-Term basis and Uptrend on Long-Term basis.
Momentum is Bearish but inflecting. MACD Line is below MACD Signal Line and RSI is below 45 but momentum may have bottomed since MACD Histogram bars are rising, which suggests that momentum could be nearing another upswing.
Support and Resistance : Nearest Support Zone is $0.000010, then $0.000008. The nearest Resistance Zone is $0.000012 (previous support), then $0.0000150.
Shib bounced!If you find this info inspiring/helpful, please consider a boost and follow! Any questions or comments, please leave a comment! Also, check out the links in my signature to get to know me better!
Looks like shib bounced off of a known flipped area.
Just as long as it continues barking... I mean breaking these levels and flipping them to support could keep climbing.
Next level coming up is 1165.
Could reject of course so would wait for it to pop up and find support on this or one of the other levels, on the bull side.
Cheers!

✴️ Shiba Inu Next Target Mapped Series ($0.2397 Next)We looked at Shiba Inu recently mentioning the potential end of the correction... This wasn't so, let's see what happened.
The first bounce, 8-Mar., was fake.
Now we have another bounce, how do we know if this one isn't also fake?
8-March there was no volume and thus prices continued lower and hit the 0.786 Fib support.
Two days of consolidation followed and 13-Mar. we get really high volume on the way up, that's the confirmation.
This can be the real deal, the real bounce/support found because buyers did show up.
Initially we had the bullish signals but there was no volume support.
The next potential target for Shiba Inu (SHIBUSDT) sits around 0.00002250 for a nice 100%+.
Higher lows lead to higher highs and the December 2022 low is the invalidation point.
This is the last one for today.
Thank you for reading.
See you on the next round.
Namaste.

SHIBUSDT likely to retrace to 0.00001075Let us try this short. It is a bit tempting and looks favorable. The price has hit the daily resistance and a push back down is very likely. Let us target 0.00001075 level.

SHIBUSDT to bounce from weekly support towards 0.00001095SHIBUSDT has hit the daily support. However, the weekly support is also sitting very close under this current daily support. A possibility to visit the weekly support level cannot be ignored. I will expect a bounce towards the 4h resistance level around 0.00001095. By the way, if patient, price hitting weekly support will give a better long opportunity.

SHIBUSDT to head again for 4h reisstance zone around 0.00001027The price was rejected from the 4h resistance and have now hit the 4h support area. I expect this support to provide enough bounce to the price to aim for the 4h resistance zone again.
