Shiba Inu 2025 Bull-Market Target An Advanced Trading TipsWhere are my Shiba lovers? Did you miss me?
Certainly, I did miss you. If you noticed that I've been away from this pair, it is because the chart wasn't looking any good.
I am back now, which means the chart looks great.
Friendly alert, I am going LONG on this pair with high lev.
Let's get started with the technical analysis.
Shiba Inu is in a long-term rising trend. The market bottom was hit in June 2023. After this bottom, we have higher prices, higher highs and higher lows.
The 2024 corrective phase is coming to its end. It produced an intermediate higher low and the action is ready, and about, to turn bullish. Here I am showing a 600% potential for growth.
The same 600% target taken from the June 2023 market bottom would be equal to more than 1,800%. You decide if this is enough for Shiba Inu in 2025 or if prices will go higher. Right now, it is hard to say.
This a simple chart, quite standard. This pair requires nothing more than patience after buy and hold. The bullish wave can take anywhere between 4 to 8 months to fully develop. Allow for a big correction in-between the first and last peak. This correction will be a period of major doubt for many participants. By now, everybody is used to bearish action and all bullish waves ending after a couple of months. When the bull-market is on, the dynamics will be much different but since it only happens once every four years, nobody remembers that the halftime correction will result in a new and strong bullish impulse.
Anyway, even knowing this it would be wise to sell at the peak of the first wave to buy back lower when prices move down, why? Because the correction can last anywhere between 1-3 months. While you will be happy saying I can wait long-term, when prices move lower and it takes so long to recover, you will wonder why you didn't sell when it was obvious that bullish momentum was dying down.
Actually, it will be hard to know the top because of the energy when it happens, everybody is happy and euphoric. But you can tell when a top is in because that's exactly when you become greedy. You will be thinking, "I can wait. I want higher. Give me more." The moment these thoughts start to happen, RUN! Secure profits on the way up. It is the only way to win. In order to win, you have to sell when prices are up. Right now is the time to buy, to buy and hold. But later, you have to produce a winning trade and that only happens when you decide to take money home.
It is healthy to withdraw. It is healthy to secure profits when your capital grows.
You don't have to be 100% right. If uncertain, sell a portion and then continue to hold.
Namaste.
SHIBUSDT

SHIBUSDT 6DSHIB ~ 6D Analysis
#SHIB Support that you might be able to consider to start buying back from here.
Reason, So far it still maintains this block of support.

Shiba Inu Burns 2532% More Tokens. Is It Enough For Rally?Shiba Inu has once again caught the crypto world’s attention. A staggering 2532.14% surge in token burns over the last 24 hours signals an aggressive push to reduce supply, which in theory, should drive up prices. Yet, SHIB has fallen 6.16% in the same period, trading at $0.00001469.
So, what’s really going on? If burns are skyrocketing, why isn’t SHIB’s price following suit?
Key Technical Signals: Bullish Reversal or Further Decline?
Despite the promising burn numbers, SHIB is hovering at a critical support level ($0.0000147). If this level fails, a drop toward $0.00001261 is likely. However, a strong hold here could spark a rebound toward $0.00001718.
🔹 Classic Head & Shoulders Pattern – Typically a bearish signal unless a breakout negates it.
🔹 Weak Network Growth – Adoption is up just 0.27%, signaling low demand.
🔹 Institutional Interest Dropping – Large transactions are down 9.95%, reducing bullish momentum.
🔹 Holders Underwater – "In the money" metric down 1.06%, suggesting more SHIB holders are at a loss.
Will SHIB Recover?
📌 Bullish Case – If $0.0000147 holds, a relief bounce to $0.00001718 is possible.
📌 Bearish Case – A break below $0.0000147 could lead to further losses toward $0.00001261.
Despite an impressive burn rate, SHIB is still struggling under bearish sentiment. For any meaningful rally, stronger catalysts—such as increased adoption or market-wide bullish sentiment—will be needed.
Meme King or Fluke?SHIB’s staging a meme comeback on the 4H at $0.00001564, bouncing from $0.00001400 in early February after a drop from $0.00002000 in January. I’m bullish. SHIB’s massive community, 120% YTD rally, and Shibaswap/staking hype make it the meme king in 2025. But is this the start of a $0.00002 moonshot, or another fluke?
Technically, we’re consolidating in a tight range near $0.00001500-$0.00001600, forming a bullish flag or triangle... breakout potential to $0.00002000 if we flip $0.00001780 (200 EMA). RSI’s at 54.38 and rising, showing buyers piling in, while Stochastic’s overbought (70.80/61.36) but not extreme, hinting at upside. Volume’s steady at 86.91B, suggesting accumulation, and MACD’s flattening from bearish, signaling a potential reversal. The 50/200 EMAs are diverging (50 at $0.00001563, 200 at $0.00001780)... watch for a Golden Cross above $0.00001780 if price holds. Trump’s pro-crypto push and SHIB’s Robinhood buzz could pump us to $0.00002500, but bears argue $0.00001400’s the floor if support fails. I’ve seen SHIB pull 50%+ pumps from similar setups in 2021... history repeating?
What’s your take?
SHIB to $0.00002000 by March or back to $0.00001400—where’s the target?
Is SHIB the meme king, or just fading hype from Shibaswap?
RSI, Stochastic, or EMAs—Which signals the breakout? Bullish or bearish?
Trump’s policies + Robinhood rumors—pump to $0.00002500, or noise leading to a crash?
Drop your targets, indicators, or contrarian views. I’ll reply to every comment and debate!

Is SHIBUSDT Preparing for a Major Move? Yello, Paradisers! SHIBUSDT has retraced to a critical support zone and is currently consolidating, leaving traders speculating about its next big move. Could this be the setup for a bullish breakout? Let’s dive in.
💎If SHIBUSDT forms a W-pattern at this support zone, backed by a supportive trendline, the chances of a bullish rally become significantly higher. This classic pattern is often a precursor to strong upward momentum.
💎However, if the retracement continues, we can anticipate a bounce from an even stronger support zone below. To stack the odds in our favor, we need confirmation from bullish signals such as - bullish I-CHoCH (Internal Change of Character), Patterns like the W-pattern or Inverse Head and Shoulders on lower timeframes.
💎Key Takeaway: Without confirmation, any bullish setup remains speculative.
💎On the flip side, if the price breaks down and closes below the strong support zone, the bullish scenario will be invalidated. In this case, it’s prudent to exercise patience and wait for more favorable price action to develop.
🎖 Discipline Over Impulse: This is why trading requires patience and a clear strategy. Avoid emotional decisions and let the market present high-probability opportunities. Mastering this mindset is what sets profitable traders apart.
MyCryptoParadise
iFeel the success🌴

SHIB To start exiting the downtrend, Shiba must first break its downtrend line and reach and cross the 0.00001856 area, which is also an important resistance.
Unfortunately, in the daily time frame and in the range of 0.00001916, the probability of a death cross is very high, and if it happens, a worse downtrend will be expected.
But if it can close a strong candle above 0.00002123 in the 8-hour time frame, the death cross will be invalidated.
My targets for the next 2 months for Shiba can be 0.00004807 and 0.00007078.
In the event of a correction and market decline, the number 0.00001028 will be available.
Shiba is dependent on the positive movement trend of Ethereum, so it can be said that with the rise of Ethereum, Shiba will also be bullish.

Shiba Inu AnalysisShiba Inu Analysis
Shiba Inu has recently experienced a downtrend, breaking through a significant support level. Currently, it appears to be retesting this level; however, this remains unconfirmed until the candle closes.
In my view, it would be prudent to await the closure of the current candle before contemplating a short position. I also believe that the pair is still aligned with the broader downward trend and has yet to complete its downward movement.
I would be interested in hearing your perspective on Shiba Inu's current market behavior. Please remember that market conditions can change rapidly, and it is essential to conduct thorough analysis and consider risk management strategies before making any trading decisions.
Cheers!

SHIB vs PEPE! Who will fall first?Pretty Obvious for me they both look weak as a stick to me. Nothing much to explain when overall stances are negative for me! Plan your trades accordingly

TradeCityPro | SHIBUSDT $1 Target ?👋 Welcome to the TradeCityPro channel!
Let’s analyze Shiba, one of the most famous meme (shitcoins) in cryptocurrency, which has changed many lives for better or worse to see if it can reach $1.
🌐 Overview Bitcoin
Before analyzing today’s altcoin, let’s take a look at Bitcoin on the one-hour timeframe. It is breaking the 96,330 support, and if our RSI enters the oversold zone, we might see a move down to the 92,701 support.
Along with this, one of the scenarios I mentioned last night is playing out—Bitcoin dominance is increasing as Bitcoin drops. Even though I personally feel this dominance increase is fake, it will still lead to further declines in altcoins.
📈 What is Market Cap?
Before starting the analysis, I want to clarify the concept of market capitalization. Market cap refers to the total value of a cryptocurrency in the market and is calculated using the formula:
Circulating supply × current price
For example, if a cryptocurrency has 100 million coins in circulation and each coin is worth $5, its market cap would be $500 million.
Market cap determines a project’s dominance and size, helps compare cryptocurrencies, and serves as a measure of risk and growth potential. High market cap projects have lower risk but grow slower, while low market cap projects carry more risk but have higher growth potential.
Why am I explaining this? So that you understand how to verify if someone claims that Shiba will reach $1. Look at its token supply and market cap. A simple calculation shows that for SHIB to reach $1, its market cap would need to be $589 trillion while the total market cap of gold is only $19 trillion! Don’t fall for misleading advertisements, stay informed!
📊 Weekly Timeframe
Like most crypto coins, SHIB spent a long time inside its weekly range, with the upper limit at 0.00001171. After spending 620 days inside this range, it finally broke out with higher lows and momentum, starting an uptrend.
After this rare bullish move, SHIB hit 0.00003279, rejected from it, and retraced to the 0.00001296 support. It then moved back up but got rejected from the same resistance, reinforcing its importance and forming an equal high, which can be seen as a double-top pattern.
This double-top pattern, which is well-known and widely used, is typically a bearish signal indicating a trend reversal. However, we cannot officially call it a double-top until the 0.00001296 support is broken. That’s why I haven’t drawn it yet.
If 0.00001296 breaks, the double-top target will be its risk-to-reward ratio of 1, meaning we could see a move down to 0.0000067.
For buying, I will never buy SHIB, no matter how much profit it makes. If I want to speculate on shitcoins, I’ll go for ones with lower market caps. And remember, if a shitcoin is meant to make you rich, it will do so even with just $10, so you don’t need a large investment :))
For selling, I suggest exiting below 0.00001296, at least temporarily. Later, if the trend turns bullish, you can buy back the same amount of USDT, potentially avoiding further downside.
📝 Final Thoughts
Stay calm, trade wisely, and let's capture the market's best opportunities!
This analysis reflects our opinions and is not financial advice.
Share your thoughts in the comments, and don’t forget to share this analysis with your friends! ❤️

SHIBUSDT Price Action - Liquidity & Order Block AnalysisPremium Zone Rejection:
Price is approaching a FVG (Fair Value Gap), which could act as a resistance zone.
If rejection occurs, smart money may be engineering liquidity to take out lower levels.
Liquidity Levels to Watch:
Feb 3 High (0.000016980): A significant level where liquidity is resting. A potential raid could occur if price breaks structure to the upside.
Feb 2 Low (0.000013080): A key downside liquidity pool where price may seek orders.
Feb 3 Low (0.000011590): The ultimate downside draw on liquidity if price continues distributing lower.
Possible Scenarios:
Bullish Case: A clean break and hold above 0.000015764 could lead to a liquidity grab towards the Feb 3 High.
Bearish Case: Failure to reclaim the fair value gap could send SHIB lower to test 0.000013080, possibly even targeting the Feb 3 Low.

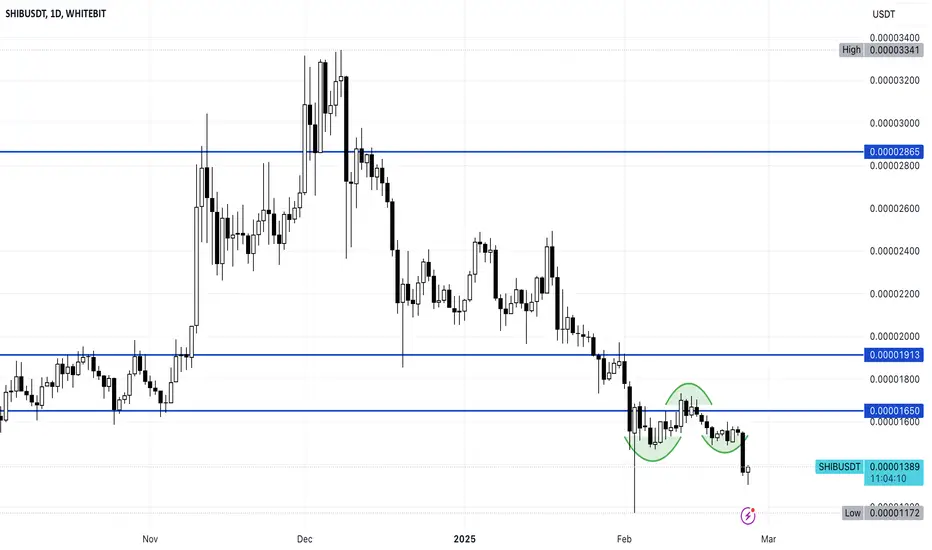
SHIBUSDT 6DSHIB ~ 6D
#SHIB Double top hard occurs in this coin meme. If the re -testing of this support block occurs, this is a very good opportunity to start buying again. Target 20%+

Is 0.000030$ the next target for Shiba Inu’s gains?Hello and greetings to all the crypto enthusiasts, ✌
In several of my previous analyses, I have accurately identified and hit all of the gain targets. In this analysis, I aim to provide you with a comprehensive overview of the future price potential for Shiba Inu , 📚🎇
We are currently navigating through a downward phase in the market, and in order to facilitate further upward momentum, an influx of fresh trading volume is essential. Our primary objective is to see a continued increase in price, though it's important to note that prior to this, we are likely to witness a series of bearish red candles. These downward movements are expected to extend until they reach our key daily support level. 📚🎇
This corrective phase is a natural part of the price action, and we anticipate it as a precursor to a potential reversal or breakout. Patience is necessary as the market works through this consolidation. Ultimately, once the support level holds, we expect a resumption of upward price movement. 📚✨
🧨 Our team's main opinion is: 🧨
We’re in a downward phase right now, and for a potential price increase, we need more volume. Before we see a rise, though, expect some bearish movement until the price hits our daily support level, after which we anticipate a bounce back.
Give me some energy !!
✨We invest countless hours researching opportunities and crafting valuable ideas. Your support means the world to us! If you have any questions, feel free to drop them in the comment box.
Cheers, Mad Whale. 🐋

SHIBAINU
The $0.000032 resistance zone is a critical supply area; we anticipate price action will react upon reaching this level and expect a bearish trend to emerge from here.
If the uptrend to the $0.000032 price level is exhausted before the well-established support at $0.0000175 is reached, we could see a decline towards lower price levels.
This is just my opinion and I would be happy to hear yours(;

SHIB Awakening? Eyes on the ChartAlright, I know CRYPTOCAP:SHIB hasn’t been getting much love recently, and it’s clear it’s been lagging considerably compared to similar dog coins.
However, I do see an opportunity, maybe a bit early, as the weekly block that interests me the most is much lower. But it seems like it’s trying to find a bottom by defending the current low from the week of December 16th.
I’ll start bidding as close to 0.00002 as possible. BINANCE:SHIBUSDT

SHIBUSDT potential move to the Up SideThe SHIBUSDT market has moved lower, forming an ABCD pullback. A false breakout occurred below the lows of the last three weeks, resulting in a long-tailed bar on the weekly timeframe. The market has adhered to the downward trendline and recently rebounded from it. With the price now climbing back above the previous weekly lows (PWLs), there is a potential for it to retest that level once more.
From a broader perspective, the strongest support level is near 0.000019, and the price may gravitate toward this area again. In the midterm, however, the market is anticipated to at least retest the lower high (LH) and possibly reach the zone above it. The key focus remains on the resistance zone around 0.000023

SHIB is ready to fly!Hello, Traders!
After setting a local high above the $0.000033 price level, SHIB entered a correction phase and is currently trading just above the $0.00002 level—approximately 35% lower than recent highs. This correction may represent a compelling buying opportunity for mid-term investors, as SHIB appears to have found its local bottom and shows signs of potential upward movement.
Yesterday's price action was particularly noteworthy: the price did not dip below the previous low, indicating a higher low, and the daily close remained above a critical support area.
These are bullish signals, suggesting that the correction phase might be coming to an end, with SHIB gearing up for a potential rally.
The first key milestone for SHIB in the short term will be to rise and hold above the $0.000025 level. Achieving this would confirm the recovery momentum and open the door for a retest of the recent highs around $0.000033.
Beyond that, if SHIB breaks past this resistance with strong volume, it could signal the start of a larger bullish trend, potentially targeting new highs.
For those seeking to capitalize on this opportunity, now could be the time to closely monitor SHIB price action and consider accumulating on dips, especially while it consolidates near $0.00002 level.
As always many depends on BTC and BTC.D as it remains to be the main driver for altcoins.
Please don’t forget to boost this idea and leave your comments below.

SHIB 50% profitThis chart presents a trading opportunity for SHIB/USDT with clear take-profit (TP) levels and a promising uptrend cycle. 📈
Analysis:
The yellow moving average (MA) highlights a trend shift to bullish momentum. SHIB's price has crossed this line, indicating a potential breakout. 🚀
A strong support level is visible near 0.00002139, preventing further downside. 🛡️
The green zone represents the risk-free entry point, suggesting limited downside risk if proper stop-loss levels are respected. ✅
Targets are clearly defined:
TP1: 0.00002373 🎯
TP2: 0.00002641 🥈
TP3: 0.00003212 🥇
A big uptrend cycle suggests SHIB could reach these targets as it attracts more buyers. 🐂
Strategy:
Entry Zone: Current price levels around 0.00002139 are favorable for opening long positions. 💹
Stop Loss: Place at 0.00002019 to limit risks. 🛑
Profit-Taking: Gradually secure gains at each TP level. 📊
Market Sentiment:
Volume bars show increasing participation, signaling that buyers are stepping in. If this continues, SHIB is likely to hit its targets. 🔥
Final Note:
This is a low-risk, high-reward setup based on technical indicators and market structure. Always monitor the market for sudden changes and stick to your plan. ⚠️

Shiba Inu Burn Rate Slips 72%; What’s Next for SHIB Price?The Shiba Inu community’s consistent efforts to reduce token supply hit a snag recently, as the burn rate plummeted 72% in just 24 hours. This decline has raised concerns among investors, particularly as SHIB’s price experienced a simultaneous dip amid a broader crypto market selloff. However, there are signs that SHIB’s future may not be as bleak as it seems, with both technical and fundamental factors coming into play.
Shiba Inu Burn Rate: A Key Market Indicator
Token burns have been a critical part of the Shiba Inu ecosystem, aimed at reducing supply and creating scarcity to drive up the token’s value. Over 2024, the community successfully burned 44.62 billion tokens, demonstrating strong commitment despite challenges.
Recent data from Shibburn reveals that the burn rate fell by 71.56% in the last 24 hours, with only 8.73 million SHIB tokens burned. The two largest burns, conducted by the same account, totaled just under 900,000 tokens. While this represents a sharp decline, it’s worth noting that the burn rate over the past seven days surged 164.53%, with over 102.86 billion tokens removed from circulation. These mixed signals highlight the need for careful analysis of SHIB’s potential trajectory.
Technical Analysis
As of now, SHIB is trading at $0.0000213, up 0.40% in the past 24 hours. The Relative Strength Index (RSI) sits at 33, indicating oversold conditions. This suggests a potential reversal if buying pressure increases. Immediate support is identified at $0.0000180, which could serve as a critical demand zone.
However, SHIB’s price movement is closely tied to Bitcoin’s performance. Should BTC dip to the $70,000-$80,000 range, SHIB’s support level may flip into a resistance zone, leading to further price declines. On the flip side, SHIB Futures Open Interest rose 34%, signaling strong market momentum that could drive a recovery if broader market conditions improve.
Ecosystem Developments
Shiba Inu’s fundamentals are also evolving, with new developments boosting market sentiment. Lead Developer Shytoshi Kusama recently outlined a vision for transforming SHIB from a meme coin to a “Shib Network State,” emphasizing the utilities of ecosystem tokens like SHIB, BONE, LEASH, and the soon-to-be-launched TREAT.
The TREAT token, set to launch on January 14, has generated significant excitement within the community. Many analysts believe this could catalyze SHIB’s price recovery, especially if paired with broader market improvements. Additionally, the Shiba Inu community’s continued dedication to burning tokens remains a cornerstone of its strategy to enhance value.
Market Sentiment and Broader Trends
The general crypto market sentiment remains bearish, with the Fear and Greed Index dropping to 42. Despite this, SHIB has shown resilience, rising 0.47% in the last trading session—a modest gain but notable in a declining market.
Conclusion
While the sharp decline in Shiba Inu’s burn rate raises concerns, the token’s oversold technical indicators and ongoing ecosystem developments suggest potential for recovery. Investors should closely monitor key support levels, Bitcoin’s price action, and upcoming milestones like the TREAT token launch. With strong community backing and strategic advancements, SHIB may yet reclaim its momentum in the evolving crypto landscape.

Trading opportunity for SHIBUSDTBased on technical factors there is a Buy position in :
📊 SHIBUSDT
🔵 Buy Now
🪫Stop loss 0.00002245
🔋Target 0.00002390
📏 R/R 2
💸RISK : 1%
We hope it is profitable for you ❤️
Please support our activity with your likes👍 and comments📝

SHIBUSDT 6DSHIB ~ 6D
#SHIB If you still have Conviction on this coin,. Buy gradually after retesting this support block, with a target of at least 20%+

How Shiba Inu Could Achieve More Gain in 2025Hello and greetings to all the crypto enthusiasts, ✌
In several of my previous analyses, I have accurately identified and hit all of the gain targets. In this analysis, I aim to provide you with a comprehensive overview of the future price potential for Shiba Inu , 📚🎇
The SHIB token has gained significant attention in recent years, especially during the peak of the bull market when its price surged dramatically. This rise was driven by a flood of investors and widespread media coverage, attracting substantial capital. As with most rapid growth phases, uncertainty soon followed, leaving much of the capital stagnant and unproductive. Despite its current lull, SHIB still holds potential for significant growth if fresh investment flows in. From experience, I've learned that markets, like life, ebb and flow, and understanding when to cut losses is essential for navigating both. In summary, SHIB is in a consolidation phase, but with renewed capital, a strong rally is still possible.
🧨 Our team's main opinion is : 🧨
SHIB experienced rapid growth fueled by investor hype and media coverage, but uncertainty has led to stagnation. Despite this, it still holds significant growth potential, and a new wave of investment could reignite its upward momentum.
Give me some energy !!
✨We invest countless hours researching opportunities and crafting valuable ideas. Your support means the world to us! If you have any questions, feel free to drop them in the comment box.
Cheers, Mad Whale. 🐋

Shiba Inu Analysis: Key Levels and Trends 24.12.30Hello, this is Greedy All-Day.
Today’s analysis focuses on Shiba Inu (SHIB).
Daily Chart Analysis
The daily chart shows that Shiba Inu recently broke below its short-term ascending trendline, which began in August 2024, within the blue box zone.
After the breakdown, the price formed a long lower wick and bounced back. This rebound occurred near the green box support zone, although slightly above its previous lows, indicating that the green box has strong support.
Key Observations:
Shiba Inu now appears to have entered the yellow box supply zone.
Although it is currently positioned near the top of this zone, if a strong rebound does not occur, the price is likely to continue falling toward the bottom of the yellow box.
Critical Level to Watch:
2056 Satoshi (white box)
This level has not been tested since the sharp decline earlier.
If the price fails to hold this level, there’s a high probability of another test of the green box support zone.
Should the green box support also fail, the price is expected to drop to the bottom of the yellow box zone.
For a Bullish Reversal:
The price needs to break above the red box lower boundary to confirm a potential rebound. Further explanation is provided in the next section.
Ichimoku Cloud and Moving Averages Analysis
To trigger a trend reversal, Shiba Inu must enter the red box supply zone, with the specific level being a 2480 Satoshi breakout.
Key Points for Reversal:
A break above 2480 Satoshi is critical to enter the upper portion of the red box.
This breakout would also mark an entry into the Ichimoku Cloud, currently acting as resistance.
Additionally, it would reverse the direction of the death cross in the moving averages, allowing for a potential bullish shift.
Until Shiba Inu stabilizes above 2480 Satoshi, it’s advisable to remain cautious with buy positions.
Conclusion
Shiba Inu is at a pivotal moment:
Bullish Case: A 2480 Satoshi breakout would mark a trend reversal and provide a stronger bullish signal.
Bearish Case: Failure to hold 2056 Satoshi could lead to further downside, potentially testing the green box and, if that fails, the lower boundary of the yellow box.
At this time, remaining patient and observing key levels is the safer approach. Let’s trade wisely and prepare for both scenarios. 🚀

SHIB/USDT Analysis: SHIB is currently gaining momentum within a long-term symmetrical triangle pattern. This consolidation phase suggests a potential breakout, and if SHIB stays above key support levels and bounces off strongly, it could retest its all-time high.
SHIB is close to the apex of the triangle, a crucial point where a decisive move is expected.
Strong upward momentum could target higher levels.
Immediate support is near 0.00002150.
Critical support at 0.00001090 is marked by the dashed red line. It is crucial to stay above this level for bullish continuation.
First Target: 0.00003000
Second Target: 0.00005000
Based on sustained momentum, potentially a retest of levels near 0.00009000.
The symmetrical triangle signals a period of indecision, but a breakout could lead to substantial profits.
Monitor volume closely to confirm the strength of the breakout, while also keeping an eye on key levels for invalidation.
If the bullish momentum sustains, SHIB has a strong chance of retesting its ATH in the upcoming rally.
DYOR, NFA
@Peter_CSAdmin
