Can Shiba's price drop continue?SHIB had a sharp price drop during the last week. After the price growth of 30% from the support area of $0.0000100, the Shiba price also increased to the resistance of $0.0000150. But there was a powerful reaction in this area, which turned back to the lower supports. The $0.0000100 support turned into resistance again, and this time the second support level in the $0.0000090-$0.0000095 range was also temporarily broken.
As you can see, we can see a range trend on the daily time frame, and as long as the current support level is maintained, there is a possibility that the Shiba price will return to the previous resistances. It is only necessary that the price returns above the $0.0000107 range at least once in the 4-hour time frame. In this case, we can expect a trend change in the 4-hour time frame. If the selling pressure continues and the current support is broken, Shiba's decline could continue to the $0.00000730 range.
SHIBUSDT
$SHIBUSDT UPDATE!!!Hi Snipers,
Please refer to the recording for the next price levels and scenarios.
Thanks
MS

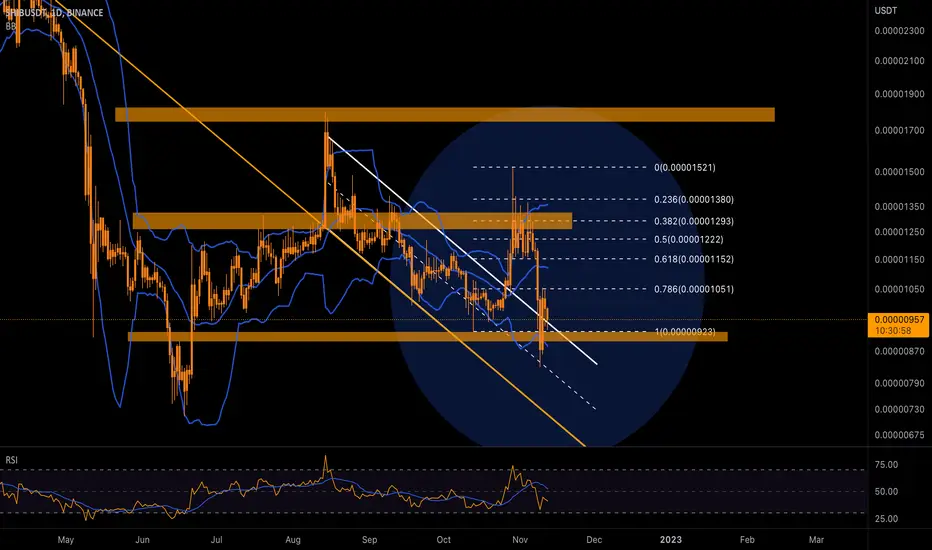
SHIB-USDT_Jsk Nov/10 to 2024SHIB-USDT_Jsk Nov/10 to 2024.
BINANCE:SHIBUSDT .
It's been a tough and slow year for SHIB. I believe it has had a very good correction just as the rest of the crypto market hence I believe we shall be seeing a recovery soon through to the next year.


SHIBUSDT LEVELS 10.11.2022 (W Candle)SHIBUSDT SPOT now traveling in exact retracement of Fibonacci and also forms in hormonic pattern and Risk Reward also good in long term. Keep strict SL at 0.000005 $ at weekly candle closing basis

Shib ready to fly SHIB is currently backtesting the POC of the whole range. this is an S/R level and GP fib Retracement from the last low. i am longing here and DCA to 117. TP is the next resistance

#1000SHIB BREAKOUT AND RETEST AND READY TO PUMP 600% !Welcome to this quick 1000SHIB/USDT analysis.
I have tried to bring the best possible outcome in this chart.
Reason for trade:- 1000SHIB/USDT is a Flag Breakout and retest complete buy the dip
SPOT CALL
Hold it for a long time to come, it can give good profit, as BTC will pump, all the calls will give you good profit and most important stop loss
Entry:- CMP $0.010700
Stoploss:- $0.009350
Target:- $0.017200, $0.020350, $0.07400, $0.035200, $0.048200, $0.061500, $0.080000
Remember:-This is not a piece of financial advice. All investment made by me is at my own risk and I am held responsible for my own profit and losses. So, do your own research before investing in this trade.
Happy trading.
Sorry for my English it is not my native language.
Hit the like button if you like it and share your charts in the comments section.
Thank you...

#SHIB/USDT Still in Buying Zone, Here's Why.I still stand with my previous update.
This is the shakeout before Shib literally goes crazy.
This is what you see in the chart. It's a perfect retest after the breakout.
SHIB looks strong in HTF.
Best to get in around this level.
SL is still a daily close below 880.
DYOR, Not Financial Advice.
Please hit the like button and Share your views in the comment section.
Thank you
Cheers

SHIB GONNA TAKE OFF SOONLots of liquidity have been induced, retail trader are going to get liquidated before the take off. #NFA #DYOR

SHIBA ready to gain 🚀Hello 🐋
Based on the chart
the price is close to the major support and better to say the previous zone that started its amazing pumping to the upside ✔️
and
we expect to see gain and pump from here, besides the range market is acceptable scenario too 📖💡🚀
Please, feel free to share your point of view, write it in the comments below, thanks 🐋

Shib will pump in next week!As we can see Shiba broke the channel pattern and consolidating around 0.000012 which it stuck for last 2 months, so that means good sign to go up. 0.000014, 0.000017, 0.00002 these are the crucial resistance zone or you can take profit.

SHIB/USDT 800% Potential Pump Ahead!! Practical?Welcome to this quick Trade Setup.
Our Last few performances:-
BTC: Called the dump target to the dollar ✅
Next BTC Target of 21k HIT ✅
SUSHI Pumped:- 26% in a day ✅
USDT on Track ✅
PYR is up 10% and still on track ✅
AR on track ✅
To verify, go through my last 10 charts 😃
DOGE pumped like crazy after Elon Musk acquired Twitter.
SHIB mostly follows DOGE and the way this chart is looking it seems like it can pop anytime soon.
If not 800% at least 100% to 250% seems imminent!!
800% is the long-term target whereas it is likely to pump at least 100% in the short term.
Tether Dominance has broken a parabolic trend, these alts are likely to go up in the coming weeks.
Even if this ends up being a trap because nothing is certain these days, the risk is way too small when you compare it to the reward and practically speaking, if you are missing these coins now you are likely to buy it higher or even the TOP.
ENTRY:- $0.00000959 to $0.00001250
SL:- $0.00000853
Target:- Please observe the chart!
DYOR, This is not financial advice.
I bought at CMP and will buy more if I see any dip.
Please hit the like button, your support means a lot to me, and do not forget to share your views in the comment section.
Thank you
#PEACE

SHIB SHIBthis is would happen IF some bull news comes such as shibarium...
if we compare doge and shib at the current time shib should be at 26-33
just in case some bull news come otherwise in my oponin crypto going to crash and real bull will start from 2-3 months later!
see my idea about dogecoin too
stay green

$SHIBUSDTHi Snipers,
Please refer to the recording for the next price levels and scenarios.
Thanks
MS

SHIBA RECOVERY - BUY ZONE SET FOR SHORT/LONG BUY (15m)I have set up a new short - long term buy on SHIB/USDT (15 Minute Time Frame).
Currently looking at an 'M' pattern, Shiba will hopefully take a fall to it's previous support as price couldn't hold it's trend line . This will take us to a major support where multiple bounces have been seen previously, especially for large upward trends long term. We could also even see a possible fake out to the downside of the trend line and a bounce back above to proceed with the upwards movement. This will all come down to the buy & sell orders currently set and s where all the investment money is set to go!
Please feel free to provide your opinions and feedback on this trade and feel free to join me!
ATTENTION:
I AM NOT A FINANCIAL ADVISOR AND DO NOT TAKE ACCOUNTABILITY FOR YOUR DECISIONS BASED UPON MY ANALYSIS!

SHIBA RECOVERY - BUY ZONE SET FOR SHORT/LONG BUYI have set up a new short - long term buy on SHIB/USDT.
Currently looking at an 'M' pattern, Shiba will hopefully take a fall to it's previous support as price couldn't hold it's trend line. This will take us to a major support where multiple bounces have been seen previously, especially for large upward trends long term.
Please feel free to provide your opinions and feedback on this trade and feel free to join me!
ATTENTION:
I AM NOT A FINANCIAL ADVISOR AND DO NOT TAKE ACCOUNTABILITY FOR YOUR DECISIONS BASED UPON MY ANALYSIS!

SHIBA INU (SHIB) is forming a bullish Gartley for upto 39% pumpHi dear friends, hope you are well, and welcome to the new update on SHIBA INU (SHIB) token with US Dollar pair.
Recently we caught a nice pump of SHIB as below:
Now this time a daily time frame, SHIB is about to complete the final leg of a bullish Gartley pattern.
Note: Above idea is for educational purpose only. It is advised to diversify and strictly follow the stop loss, and don't get stuck with trade

SHIBAUSDT|30 Percent DealHello trader Today I have prepared a new idea for you. Like and subscribe to the channel there is a lot of useful information✅
The asset broke through the global trend line and was able to consolidate higher, which means that there is a chance to get a rebound again to the Fibonacci 0.618 zone.
The asset is now testing a trend line in the form of a double bottom, this pattern works out 80% for a rebound up

Shiba Inu SHIB bullish ahead of the FOMC Press ConferenceI am bullish on Bitcoin BTC ahead of the FOMC Press Conference.
Those are my price targets:
SHIB/USDT
Entry Range: $0.00001200 - 0.00001300
Price Target 1: $0.00001510
Price Target 2: $0.00001730
Price Target 3: $0.00001960
Stop Loss: $0.00001100

SHIBUSDTHello Crypto Lovers,
Mars Signals team wishes you high profits.
This is a one-day-time frame analysis for SHIBUSDT
In the current chart, you see R2 and R1 as the resistance areas which both contain the disability of the price to rise. S1 used to be another resistance area and S2 is a support line with the well support of price. Thus, we have the price fluctuating below R1 area and our expectation would be a decline to S1 line (according to its past trend) and there we should have some confirmation candles to rise and the long position of our chart is activated and an increase is waiting for the price to higher amounts. Make sure to consider the confirmation candles for having less risky trades.
Warning: This is just a suggestion and we do not guarantee profits. We advise you to analyze the chart before opening any positions.
Wish you luck

SHIBUSDT second try to flip EMA since August $SHIB | $USDT
After a massive pump SHIB is now retesting daily SMA for the second time since August, this daily SMA needs to be flipped for a massive pump or else we will get a rejection & retest the support where we can enter longs...
#shib #shibainu #shiba #dogecoin #FOMC


SHIB to plunge -70%?Please 1st of all click the boost 🚀 button if you want me to post more ideas and follow me to support my work! It's absolutely for free.
#SHIBARMY , unfortunately not a good news for our beloved one!🐕 Price formed huge Head and Shoulders pattern which just got triggered by breaking the neckline. Target 0.00000265 being -70% lower from current prices which would mean enormous pain for our puppy. The price could respect the downward channel boundaries on the way to the target. Please don't shoot the messenger, just posting what I see, all that for free! 😇
For further reference please check the post down below:
Check my other stuff in related ideas.
Please boost🚀, comment🗣️, follow me✒️, enjoy📺!
⚠️Disclaimer: I'm not financial advisor. This is not a financial advice. Do your own due dilingence.
