Shiba Inu (SHIB) with a daily breakout !!!Shiba Inu (SHIB) with a daily breakout !!!
If today's candle closes strong like this and we see further gains (in best case confirmed by new support line)...
...next target at $0.00002484 (LOG FIB 50%) can be reached quick since the volume resistance above isn't that significant dear Crypto Nation
What are your thoughts on that breakout?
*not financial advice
do your own research before investing
SHIBUSDT


Update SHIB: Up 40% ! 143% potential gainsSince the previous post. SHIB pumped 40% already.
Time to move the stoploss above my entry point, to lock in some profits. The rest is free trading.
Remember to always take profits and use proper risk management!
Thank you for reading.
Namasté 🙏
Disclaimer: Ideas are for entertainment purposes only. Not financial advice. Your own due diligence is highly advised before entering trades. Past performance is no guarantee of future returns.
What Indicators Do I Like To Use:
I am using the "Supertrend Ninja - Clean", which is a trend-following indicator (Green and red vertical lines on the background). When the background of the candlestick closes green (vertical line). It indicates a possible bullish (up)trend. And red for possible downtrends.

Shiba dropped 70% after signal - now potential rise of 143%?SHIB dumped 70% (purple price range) after the bear Supertrend Ninja - Clean signals (red vertical line on the background). Now there is a bull signal (green vertical line on the background) indicating a possible bull run to around to 2000 sats (0.382) or 2800 (0.618)) forming Wave 4. Which is about 143% (orange price range) possible gain.
SHIB is still below the the Ichimoku Cloud , which is considered bearish . Currently it is trying to break a resistance area at 1200. The RSI is still in a range/ slightly bullish at 52. RSI Brown at 72. If we take a look at the Average Directional Index ( ADX DI) its indecisive, as it is ranging. Almost horizontal. Currently SHIB is above its Basis Bollinger Band , Band Basis 20 Period SMA . While it is below the LSMA .
In short, SHIB is still stuck in a range on the 2Day chart. Although I am leaning towards a bullish scenario. Since SHIB price and the RSI are still forming a higher low. I do see an Ascending Triangle. Which is a bullish sign as well. Time will tell.
Remember to always take profits and use proper risk management!
Thank you for reading.
Namasté 🙏
Disclaimer: Ideas are for entertainment purposes only. Not financial advice. Your own due diligence is highly advised before entering trades. Past performance is no guarantee of future returns.
What Indicators Do I Like To Use:
I am using the "Supertrend Ninja - Clean", which is a trend-following indicator (Green and red vertical lines on the background). When the background of the candlestick closes green (vertical line). It indicates a possible bullish (up)trend. And red for possible downtrends.

SHIBUSDT, Breakout the resistance. SHIBA inu. UpdateHello my friend, This is an update of previous analysis (blow link). Everything is clear on the chart for you like always. Shiba after trade range and accumulation, Breakout the resistance. you can enter now or after consolidation and fixation above the resistance to safe buy with low risk.
Good luck.
If you like the idea, do not forget to support with a like and follow me for next analysis :)
Write your comment and opinion below to me

SHIBUSDT |Is it going to be a big explosion or will we get a rebHello everyone, I wrote a new idea for you. I think it's easy to like and subscribe to the channel, thanks😉
📌 Friends, let's go through the SHIBA meme coin today
📌 At the moment, we see that shib is in a global downtrend, which means that the coin is almost at the very bottom, there are several options for buying #shiba to buy either on the breakdown of the countertrend double on futures with a small leverage, which can give a good profit for the short term.
📌 Or there is another option to buy an asset for the long term in your investment portfolio, of course, the coin is doubtful for investment at a large percentage, well, I think it can give 2-3%.
📌 Shib may fall even lower than these values, now Bitcoin dominance is underway, alts dominance is almost at the bottom and when Bitcoin starts breaking through to $ 30,000, alts can sprinkle -20% -30 percent.
📌 So you need to consider here that you can go below and buy a coin for the long term, we know that big players like to buy projects at the bottom!

Ethereum:Update :Target Reached:New AnalysisHello friends
.Update analysis
..Trade Close:Target Reached
.tp: 34% ... (Note: This analysis was done in two parts and gave us 100% profit in total)
📢.New Analysis
.The rejection price is currently in the resistance range:
1. The first scenario of price correction.
.2. The second scenario of resistance failure
..You can view and compare the attached chart and analysis
..Follow me to see more analysis

SHIBA | Dogs Are Our Links Tp Paradise Give this dog some time to warm up to the world, young shiba will soon be apart of our dailyto day lives

Shiba Inu SHIB Entry Range, Take Profit and Stop LossSHIB/USDT
Entry Range: $0.00001200 - 0.00001310
Price Target 1: $0.00001400
Price Target 2: $0.00001725
Price Target 3: $0.00002050
Stop Loss: $0.00001010

SHIB forming bottom pattern on daily chartSHIB/tether is forming a classical bottom pattern that could launch a very strong advance

Shiba Breaking out DowntrendBINANCE:SHIBUSDT
✅Before we start to discuss, I would be glad if you share your opinion on this post's comment section and hit the like button if you enjoyed it.
Thank you.
Last time Shiba Inu spent 145 Days in accumulation zone before massive pump! History can rhymes and we can see around October full reversal move up! now we almost 290 days in downtrend, Big players sale enough coins so now they need time to accumulate it for next bull run
Possible Targets
➡️First target where we can find out resistance 0.86 level by FIB
prepare yourself for long time accumulation.
Hope you enjoyed the content I created, You can support with your likes and comments this idea so more people can watch!
✅Disclaimer: Please be aware of the risks involved in trading. This idea was made for educational purposes only not for financial Investment Purposes.
* Look at my ideas about interesting altcoins in the related section down below ↓
* For more ideas please hit "Like" and "Follow"!

BITCOIN:Trade Close:Target ReachedHello friends
.Update analysis
..Trade Close:Target Reached
..You can view and compare the attached chart and analysis
..Follow me to see more analysis
Analyzer: Joseph

$SOLUSDT UPDATE!!!Hi Snipers,
Please refer to the recording for the next price levels and scenarios.
Thanks
MS

BITCOIN : H1 Hello friends
📉Based on the chart: Important levels are marked
.The price is currently at a resistance level. It is also breaking a RISING WEDGE pattern
.We will have two scenarios
.The direction of movement is shown in the chart
.📢 Please follow your strategy, , this is just my idea
.🙌Please do not forget the ' like' button & Share it with your friends
.✍ I will be glad to see your ideas in this post
.🧲Follow me to see more analysis

SHIBUSDTWith a five, Elliott has reduced the price. Now we have to draw a fibo retracement from the beginning of this cycle to the end of it ( 0 to 5) and the minimum correction (here correction means price growth) will be 61.8% fibo.
NEXT TARGET IS FIBO 78%
The vertical lines of time analysis are based on Fibonacci

SHIB - Short on the news. Another tryReasons to take short:
⭐️ CPI released today
⭐️ Couldn't update high
⭐️ Volume at top
⭐️ Engulfing candle at high
⭐️ 52 days
⭐️ 3rd touch
⭐️ 50 ATR
Will enter when price squeezes to the trendline on 5m timeframe, the base will form and the tape will get faster.
Fix profit by parts:
1% - 1/3
2% - 1/3, stoploss to breakeven
What's left, hold to the maximum
What do you think of this idea? What is your opinion? Share it in the comments📄🖌
If you like the idea, please give it a like. This is the best "Thank you!" for the author 😊
P.S. Always do your own analysis before a trade. Put a stop loss. Fix profit in parts. Withdraw profits in fiat and reward yourself

SHIB big dangerSHIBA INU sweeped big liquidity and formed POI for good shorting zone. We expect SHIB to go down and grab all the trendline liquidity which is formed on the bottom.

SHIB - Woof-Woof! Bounce from trendlineReasons to take long:
⭐️ BTC 70 ATR
⭐️ Big volume at bottom
⭐️ Trendline is clearly seen on daily timeframe
⭐️ Impulsive movement
⭐️ 105 ATR
Fix profit by parts:
1% - 1/3
2% - 1/3, stoploss to breakeven
What's left, hold to the maximum
What do you think of this idea? What is your opinion? Share it in the comments📄🖌
If you like the idea, please give it a like. This is the best "Thank you!" for the author 😊
P.S. Always do your own analysis before a trade. Put a stop loss. Fix profit in parts. Withdraw profits in fiat and reward yourself

SHIBA | Getting Ready for a Massive Breakout..!!
#SHIBA (update)
Forming Massive Descending Channel in daily timeframe.
So far Looks Extremely bullish & ready for a Massive breakout.
In Case of Breakout, Expecting +200-240% Bullish Rally in Coming Days.
Please like the idea for Support & Subscribe for More ideas like this and share your ideas and charts in Comments Section..!!
Thanks for Your Love & Support..!!

SHIBUSDT, in trade range zone and accumulationHello my friend, Everything is clear on the chart for you like always. Shib in trade range and accumulation for now. it's better to monitor the volume of transactions and any break to enter.
Good luck.
If you like the idea, do not forget to support with a like and follow me for next analysis :)
Write your comment and opinion below to me

SHIB / USDT on 1Day IntervalHi everyone,
Let's take a look at the SHIBUSDT chart on the 1 day time frame.
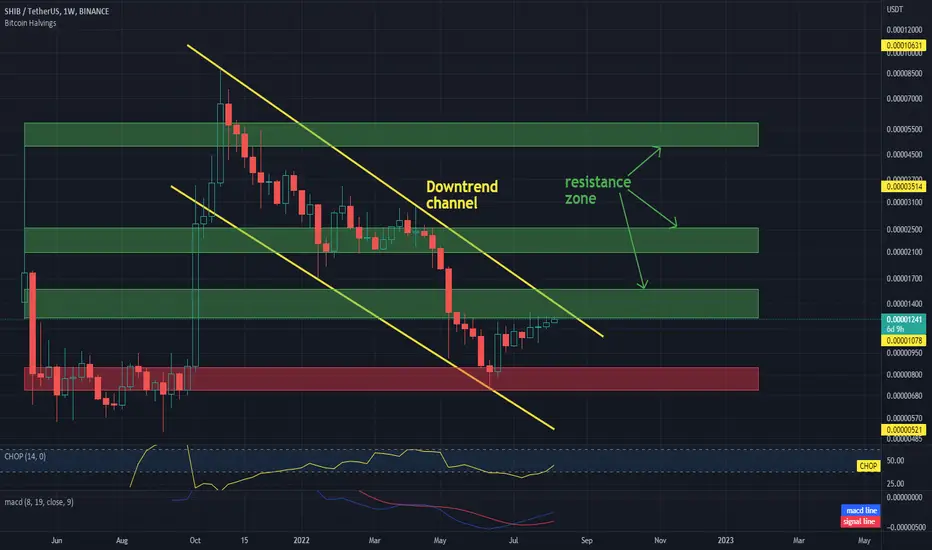
As you can see, we are moving in the downtrend channel marked with yellow lines.
It is worth setting a support zone from which the SHIB price has rebounded, and 3 important resistance zones that the price has in front of it. We are currently fighting the first one from $ 0.00001245 to $ 0.00001567. However, it should be taken into account that in order to break the first resistance zone, we have to leave the downward channel upwards and change the trend in the long term.
The CHOP indicator shows that we are starting to gain more and more energy and the MACD indicator shows a local upward trend.
An idea for tradersPossible movement based on several patterns including Elliott and head and shoulders pattern.

SHIBUSDT |Coin Review| Short term deal#SHIBUSDT
The price is approaching the testing of the upper border of the "ascending triangle" pattern
I also highlighted two zones of local resistance on the chart, with a successful breakdown of the triangle, it looks like a good deal in LONG. An approximate plan is shown on the chart.
Not financial advice, make your own decisions whether you should enter a trade or not.
Also write your comments what do you think about this forecast and put likes
