A Bull run in ShibHello traders!
Welcome back to another episode with analyst Aadil1000x.
Today is the buying day. The market is about to rise and Shib is also in favor of bulls. Once there is a breakout of the trendline Shib will fly.
Shib Target is 0.00001797 which is a +50% move.
Don't forget to give some boost and follow to stay connected.
SHIBUSDT

SHIBUSDTHello Crypto Lovers,
Mars Signals team wishes you high profits.
This is a 4-hour-time frame analysis for SHIBUSDT
In this chart, we have R1 as a resistance line that expresses the unsuccessful triumphs of the price to rise. And S1 and S2 are our support areas which contain the support of the price at several points. At the moment, you see that the price is fluctuating on S1 line and we expect it to face two possibilities. Either it is able to be fixed here and by receiving some confirmation candles, it is able to rise to R1. Or the price may not be supported and start a falling trend toward S2. So we should wait for some confirmation signs (candles) to get out position and put our orders in trade.
Warning: This is just a suggestion and we do not guarantee profits. We advise you to analyze the chart before opening any positions.
Wish you luck

SHIBUSDT LEVELS 02.08.2022 (D Candle)SHIBUSDT trying to breaks major resistance at 0.0000130,once its break and closed in daily then will expect good move in short term

SHIB: another dogo is preparing to PUMP🔥You have to make +20% if you buy the SHIB on the breakout of the trendline using my scenario. Check this idea to get more experience in trading!
SHIB is squeezing to the key level of $0.1297 and don`t make a pullback after the key level false breakout. The price have to drop by 20-30% but not. You have to pay attention to such unusual things. This info will be really useful at the bull market when the price continue to rise✅after the bull traps. That's what I tell my students.
🔥The volume indicator confirmed that a lot of buyers accumulate SHIB at the bottom.
The target for this local accumulation is closest value area of $0.2125-0.255.
A lot of traders will close their position in breakeven so i think it will be the best area to close the part of your long.
🚩Check the links in my profile to get more ingo about trading and my free trading strategies for beginners.
💻Friends, press the "like"👍 button, write comments and share with your friends - it will be the best THANK YOU.
P.S. Personally, I open an entry if the price shows it according to my strategy.
Always do your analysis before making a trade.

BITCOIN:H4Hello friends
📉Based on the chart: Important levels are marked
.The price has reached a short-term downward trend line. We are waiting for a trend break or a price correction
.The price is moving in two short-term ascending channels at the same time
.This analysis is personal opinion
.🧲Follow me to see more analysis
.✏Analyzer: Joseph
.Date of analysis:31jul


Shiba Inu (It Is All Done For Your Entertainment)Even though my first reaction was like, "Leave me alone I am trying to work...", I still like to make people happy.
So someone asked for me to read the chart for SHIBUSDT (Shiba Inu), they want to know what I see.
Ok... That's fine my with me.
It will be my pleasure.
I hope you enjoy the content.
Let's get started!
The #1 is the initial phase.
Here we have a strong consolidation phase that lead to a major bullish wave.
The #2 is the second phase.
We are having another consolidation phase before the next bullish wave.
It is that simple, we have higher lows long-term.
Higher lows lead to higher highs.
This person that is asking is very likely getting paid...
But they won't pay me, they want it for free...
And they won't even support me when I hit publish... That's how it works, they ask, ask, ask, ask, ask and ask... Receive but in return show no support.
That's fine.
I am not doing it for money.
I am doing it because someone, somewhere, can benefit from these posts.
Namaste.
P.S. It is supposed to be funny even if it sounds harsh.

SHIB gives big profit! Forecast!After a good growth - it's time to go for a correction, I expect further growth after a slight decline!
In order not to miss a buy signal, subscribe and stay tuned for new ideas. Every day I post 10 profitable ideas a day.

Amazing one! SHIBUSDTHey, everyone!
Shib is in awesome buy zone right now!
It's a chance for everybody
Now waiting for the pump in 2-3 month;)
Add this coin to you watchlist
Best wishes!!!

SHIBA long$SHIB is bouncing off the support level. Descending trendline was also broken and correction to 0.00001$ is possible.

SHIBUSDTHello Crypto Lovers,
Mars Signals team wishes you high profits.
This is a 4-hour-time frame analysis for SHIBUSDT
As we analyzed on July 20, we had a short position and we expected a falling trend and now this has happened and all of our targets are hit. In this chart, we have R2 as our resistance area and the unsuccessful triumphs of the price to rise is shown. R1 used to be a support line and S2 is our support area which expresses the support of the price at some points. At the present, the price is fluctuating over S2 and we predict little fall and then by a rise and pull back to R1, our short position is activated and therefore the price is expected to have another decline to S2. R1 is considered a good area for saving profits. Even it is possible for the price to rise over R1 and by receiving some confirmation candles there, we will predict more rise for it.
Warning: This is just a suggestion and we do not guarantee profits. We advise you to analyze the chart before opening any positions.
Wish you luck

SHIBUSDTHEY GUYS what do you think about SHIBA?
If this post was useful to you, do not forget to like and comment.❤️

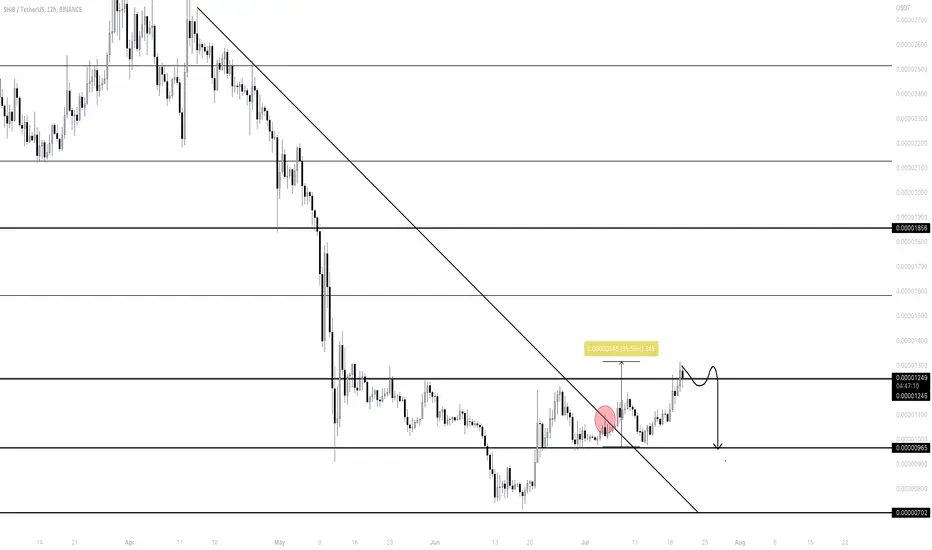
Shiba Inu SHIB short Entry Range, Take Profit and Stop LossSHIB/USDT short
Entry Range: $0.00001100 - 0.00001200
Price Target 1: $0.00001000
Price Target 2: $0.00000831
Price Target 3: $0.00000722
Stop Loss: $0.00001367
the short at $0.00003355

Best opportunity to buy SHIB (Shiba Inu)Shiba Inu in corrections and after breakout the triangle, rise to $0.00002.
It's best opportunity to buy 1000shib, Don't miss it.

SHIBUSDT 6H TA; Break TrendLineAccording to the chart, the upward trend line has been successfully broken and the pullback is being completed, if it crosses the resistance range specified in the chart, it is suitable to enter. Otherwise, we will have correction.
Its not Buy or Sell SIGNAL
DYOR
BY : Mohamad Teriz - @AtonicShark

Ichimoku Analysis for SHIBWill long SHIB once out of the cloud and the resistance line. Will reach 0.00002 as first tp.

SHIBUSDT | Wave Projection | downtrend breakout Inverted H&SPrice action and chart pattern trading
> Wave projection double zigzag correction ABC with downtrend channel breakout and EMA5 crossover SMA50 above neckline
> Inverted head and shoulders breakout, possible wave 1
> Target @ previous A-wave +50% upside
> Stoploss @ right shoulder -15-20% downside
> RRR 3:1
Always trade with affordable risk and respect your stoploss

SHIBAUSDT This is probably the end of the growthHello everyone
I have prepared a new signal for you, I write every day 10 profitable trades for the Russian and English audience, I think it will not be difficult to like and comment on the idea, your feedback is very important to me Go to the channel there is a lot of useful information.
SHIB Shows good results, after the last signal +30%
What is happening on the chart? The asset has broken through the local trendline and then gives a light 30%
What do I expect next? I think that the breakdown of the 0.2 Fibonacci level will somehow fix above this level, after which the price will begin to fall to the level of $0.0972
BTCUSDT_Daily_2022-07-20If Bitcoin is confirmed, at the ceiling of the ascending channel, it can climb up to the specified trend line, if the trend line breaks, it can climb up to the range of $29,000.
If Bitcoin does not stabilize at the ceiling of the channel and penetrates into the channel, it can fall to the bottom of the channel in the range of 20,000.
Wednesday, 20 July 2022

SHIB/USDT: Bullish reversal on going---- Mid-term Analysis for the next coming 4 weeks to 3 months - Daily on Daily Chart (LOG)-------
SHIB/USDT: Bullish reversal on going
Context
The Global Crypto market leads by BTC and ETH is still evolving within a bearish market configuration. Like the others digital asset Shiba Inu (SHIB) is suffering about negative global market situation, and with a massive total supply of 1,000,000,000,000,000 (55% of the supply in circulation) it is hard to see a fondamental bullish pressure to be set from the supply management.
Main ressources
Coin Market cap (Supply) =>https://coinmarketcap.com/currencies/shiba-inu/
Shiba Token (Website) = > shibatoken.com
Market configuration
- Graphical Elements :
Graphical Resistance = 0,00001570/1930 & 0,00002840
Graphical Support = 0,00000950
- Mathematical Indicators:
EMA ( Exp Moving averages) are support = Bullish
RSI indicator (below) is reintegrating 50% = Bullish
- Elliot & Harmonic Wave (Fibonacci):
Fibonacci Target c B hasn't been already reached = 0,00000685
Fibonacci support of the wave (ii) = 0,00000950
Fibonacci Bullish Target = 0,00001930 & 0,00002840
Conclusion
Prefered case => As long as 0,00000950 remains support a further rise towards the upper part of the bearish channel at 0,00001570 before 0,00001930. After having reached those target a larger rise will be confirmed

SHIB/USDT: Remain under bearish pressure---- Mid-term Analysis for the next coming 4 weeks to 3 months - Daily on Daily Chart (LOG)-------
SHIB/USDT: Remain under bearish pressure below 0,00001875
Context
The Global Crypto market leads by BTC and ETH is still evolving within a bearish market configuration. Like the others digital asset Shiba Inu (SHIB) is suffering about negative global market situation, and with a massive total supply of 1,000,000,000,000,000 (55% of the supply in circulation) it is hard to see a fondamental bullish pressure to be set from the supply management.
Main ressources
Coin Market cap (Supply) =>https://coinmarketcap.com/currencies/shiba-inu/
Shiba Token (Website) = > shibatoken.com
Market configuration
- Graphical Elements :
Graphical Resistance = 0,00001875 & 0,00002840
Graphical Support = 0,00000510
- Mathematical Indicators:
EMA ( Exp Moving averages) are capping the market at 0,00001875 = Bearish
RSI indicator (below) is below 50% and bearish trend line - no divergence = Bearish
- Elliot & Harmonic Wave (Fibonacci):
Fibonacci Target c B hasn't been already reached = 0,00000685
Fibonacci support of the wave c B (max extension) = 0,00000510
Fibonacci Bullish Target = 0,00002840 & 0,00005190
Conclusion
Prefered case => As long as 0,00001875 remains a key resistance the SHIB is expected to reach lower target at 0,00000685 before any bullish reversal tentative
Alternative case => In case of 0,00001875 resistance breakout, the bearish trend will be invalidated opening the door to 0,00002840 & 0,00005190

SHIBUSDTHello Crypto Lovers,
Mars Signals team wishes you high profits.
This is a one-day-time frame analysis for SHIBUSDT
As we analyzed on July 3, we expected a rising trend and clearly you see the rise has happened after that and all our targets are hit. In the present chart, you see R1 as the resistance area and it expresses the unsuccessful triumphs of the price to rise. And we have S1 as the support area and it contains the support of the price at several points. At the moment, we have the price fluctuating in R1. The long shadows in the previous candles mean there will be a decline in the price. We predict the price will rise to the height of R1 area. This is a good area for saving profits and then we consider a short position here and after that a decline to S1 will be expected. In case the price is able to fix itself over R1, then we predict more rise for it.
Warning: This is just a suggestion and we do not guarantee profits. We advise you to analyze the chart before opening any positions.
Wish you luck

Shiba Inu Is Set For Exponential Growth (70% Short-Term)By short-term we mean within a month (within 4 weeks).
When we say mid-term we are talking about a 1-3 months time window.
And finally, long-term can be 3-12 months...
But these are just approximation, we spot trend-reversals, buy and hold and let the market take care of the rest.
The waiting time can be one day, 1 week or 6 weeks it makes no difference because we only close a trade if it goes below the stop-loss.
Shiba Inu (SHIBUSDT) closed yesterday above EMA50 ("conquered" this level) and now it is time to grow.
We are looking at 70% potential profits short-term.
After we hit this target, we share a new analysis to see what comes next.
But very likely we get a correction/retrace.
Each time a strong resistance level is tested/challenged a correction takes place.
This is normal price action.
Namaste.
