ShibaInu SHIB price at critical zoneJust look who decided to wake up - it's our sweet #ShibaInu
CRYPTOCAP:SHIB price is near the upper boundary of the falling channel, it can break through to $0.000020-0.000021
But a safe medium-term purchase, after the OKX:SHIBUSDT price breaks out and fixes outside the channel and closer to $0.000015
This is depicted schematically with a blue zigzag)
_____________________
Did you like our analysis? Leave a comment, like, and follow to get more
SHIBUSDT

Should we buy #Shib or wait?The specified area is very important and vital for #Shiba, if this area is not broken, the price will have a sharp fall, if this level is broken, it can also bring a strong price growth. If you haven't bought Shiba yet, wait for it to cross the trendline and resistance level. If you already have Shiba, you can cross this zone with the risk of freeing.
Overall, this area is very important, and I think the price has been deliberately kept in these areas so that if the Bitcoin situation remains positive, Shiba will also break this level and prepare to conquer higher prices.
#shib

Shiba Inu shows mixed signals: What’s next for SHIB?Over the past week and month, Shiba Inu (SHIB) has posted steady gains despite market volatility. In the last 24 hours alone, it added 2.67%, reflecting the current trends across the broader market.
Shiba Inu was consolidating within a symmetrical triangle pattern, a technical formation where prices oscillate between narrowing resistance and support levels. This signals a potential build-up for a significant price move.
Traders appear to be accumulating SHIB, betting on a breakout that could trigger a rally. The rationale is simple: higher holdings now could translate into greater profitability if the price takes off.
A breakout from this consolidation could push SHIB toward $0.00002954—a level where strong selling pressure might emerge and potentially cap further gains.
However, while the accumulation phase is underway, technical indicators suggest the anticipated breakout could be delayed.
One indicator is the Parabolic SAR, which has formed dots above SHIB’s price—indicating potential downward pressure that could push the asset’s price lower.
The Relative Strength Index (RSI), which measures the speed of price changes and gauges market sentiment, shows similar bearish signals.
As of this writing, the RSI has shown a downtick, with the price following suit. If this downward momentum persists, SHIB could see a further decline.
The expected target for this move is the support level within the symmetrical triangle pattern, where the price may seek renewed buying interest before any significant upward trend resumes.

SHIB SHORT IDEA - 1000SHIB FUTURES SHORTPrice hit to supply zone and looks pretty heavy imo. LTF market structer shifted and it gave me confident to enter short side. I am also awaiting bitcoin to drop a litle (see my bitcoin chart on my profile) so they can work together.
Targets can be seen on the chart.
Nothing i share is financial advice. Education purposes only.

shibusdt → a short positionhello guys!
I suppose Shiba hunted the last level!
it is a risky position but I will sit on the short position for this situation!
___________________________
✓✓✓ Always do your research.
❒❒❒ If you have any questions, you can write them in the comments below, and I will answer them.
❤︎ ❤︎ ❤︎And please don't forget to support this idea with your likes and

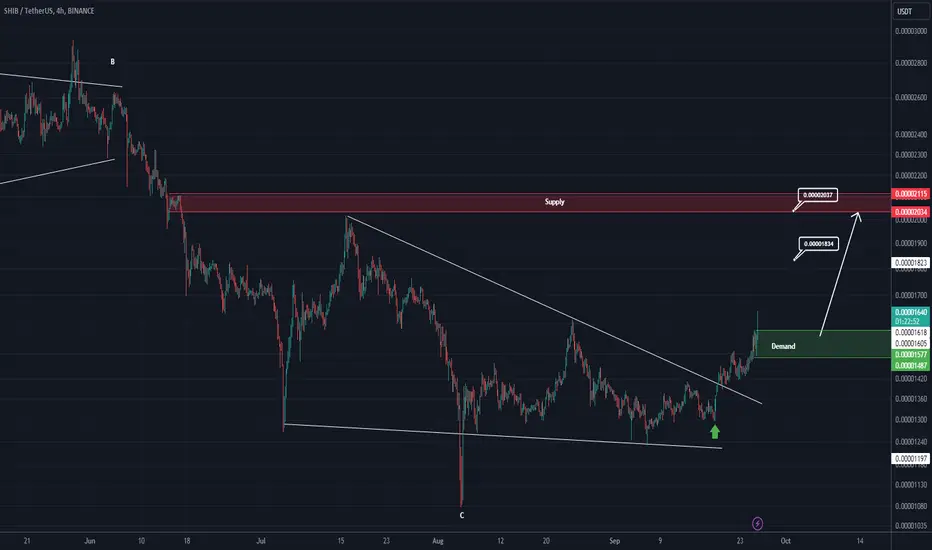
SHIBUSDT potential test of Down Trend Resistance lineSHIBUSDT is currently in an accumulation phase, with the price oscillating around the 0.000015 level. The market has bounced off this support level twice before initiating an upward impulse move. The most recent swing upward was stronger than the previous one, signaling a potential increase in bullish momentum. Growing expectations of a possible bull run could act as a trigger for further upward movement. The market continues to bounce off the upward trendline, forming higher lows, which indicates buying pressure. Based on this analysis, the price could retest the channel border, potentially leading to further bullish momentum. The target is the resistance zone at 0.00002.

Shiba In (SHIB) shows bullish head and shoulders patternSHIB, the second-largest coin, plunged over 8% during Monday’s U.S. market trading hours. The sharp plunge can be attributed to Bitcoin drop below $65,000, with an intraday loss of 3%. With the meme cryptocurrency sector often volatile to new market changes, the Shiba Inu price hints at a potential retest to $x. support. Will the uptober rally sentiment trigger a major reversal?
Since last weekend, the Shiba Inu price witnessed a notable correction from $0.0000217 to $0.0000178, accounting for an 18% drop. The bearish turnaround likely coincides with the broader market pullback as Bitcoin drops below $65,000 on Monday. With sustained selling, the SHIB price could tumble another 9% before retesting suitable support at $0.000016.
The aforementioned level, coinciding with a bullish crossover of 20-and-100-day exponential moving average after 100 days, could recuperate the bullish momentum. The potential reversal will likely reveal a bullish reversal pattern called Inverted Head and Shoulder in daily charts.
The chart setup consists of three lows, where the middle low (the “head”) is the lowest, and the two outer lows (the “shoulders”) are slightly higher. If the pattern holds true, the Shiba Inu price could rebound from $0.000016 and rechallenge the neckline resistance at $0.000022.
On the contrary, if sellers drive a breakdown below the $0.000016 level, the buyers would also lose EMAs support and invalidate the bullish thesis.

Unlocking Potential: Guide to Buying SHIBUSDT on SpotIn this detailed guide, explore the intricacies of buying ShibUSDT on the spot market. We'll cover the essential strategies for timing your purchases, managing risks, and understanding market signals. As Shiba Inu continues to gain traction in the crypto community, this guide will help you navigate the volatility and make informed decisions. Whether you're looking to diversify your portfolio or ride the wave of Shiba Inu's popularity, this guide provides the tools to optimize your spot trading experience.

SHIB Is BullishFrom where we put the green arrow on the chart, it looks like a big bullish triangle is over.
By maintaining the green range, it can move towards the targets.
The targets are marked on the chart.
Closing a daily candle below the invalidation level will violate the analysis
For risk management, please don't forget stop loss and capital management
When we reach the first target, save some profit and then change the stop to entry
Comment if you have any questions
Thank You
SHIB Major Trend. 09 2024Logarithm. Time frame 1 week.
Line chart , without market noise.
Secondary trend. Channel Zone.

SHIB/USDT Secondary trend. Channel. 14 months accumulation.Logarithm. Time frame 1 week for clarity of the channel range. 3 weeks ago, there was an exit of the price under the support of the accumulation channel by a large percentage. Many long positions were liquidated.
The chart shows the percentages from this reversal zone to the channel resistance, as well as the average profit percentage when exiting this accumulation channel from the average set price to the significant first resistance.
This is what the chart of this cryptocurrency looks like on a line chart without the “market noise” volatility.
Accumulation Zone. Pump/Dump and compliance with risk and money management.
Remember, this is a pamp/dump meme cryptocurrency, which even at -93% down from peak pumping and with a set zone of about 14 months (!) is at an inadequate profit. That's why follow risk management in your work.
It is more rational to work on such cryptocurrencies, not with stops (high volatility, slippage at high %, high probability of beaten out before price increase, the large value of stop is meaningless, they can beat out at -2% and -40%), and work from average buy/sell price (only spot!) with reasonable observance of money management.

SHIB ANALYSIS (update)🔮 #SHIB Analysis - Update 🚀🚀
💲 As we said earlier #SHIB performed the same. More than 40% move already done in #SHIB Now we can see a little retest from its major resistance zone and after that a bullish move would be seen
💸Current Price -- $0.00002127
📈Target Price -- $0.00002747
⁉️ What to do?
- We have marked crucial levels in the chart . We can trade according to the chart and make some profits. 🚀💸
#SHIB #Cryptocurrency #Breakout #DYOR

Shiba Inu (SHIB) price prediction amid 15% daily rallyShiba Inu (SHIB) recorded a sharp upswing on the 26th of September, posting 14.5% gains and extending its monthly recovery to 35%.
This remarkable performance eclipsed even Bitcoin (BTC), which posted 2% on the daily charts and remained quiet overall.
However, the SHIB’s upswing retested a key hurdle, which begs the question: Can bulls mount above the roadblock and push forward?
The stochastic RSI and RSI flashed bullish signals on the daily chart, underscoring a strong buying pressure for SHIB in the past few days.
However, they also indicated overbought conditions, which often signal a potential price reversal. Given the bullish market structure, the uptrend momentum could continue.
If so, late bulls could seek re-entry after breakout or retest above the resistance at $0.000001763 (marked white) or $0.000018 (April low).
The bullish target would be the 200-day Moving Average (MA) at $0.000020. The bullish target would offer 15% or 11% potential gains based on the two entry positions.
That said, a daily candlestick close below $0.000017 would invalidate the above bullish thesis. SHIB could front a pullback to $0.000015 in such a muted scenario.

SHIBUSDT (SHIBA INU) Updated till 27-09-24SHIBUSDT (SHIBA INU) Daily timeframe range. finally we can see a move here almost close to 0.00002009 resistance. it do have potential to cover more space depends on retail interest. some cash flow into mcap also can help. recent support at 0.00001570.

SHIBUSDT Is a Major Bullish Breakout About to Happen??Yello, Paradisers! Could #SHIBUSDT be on the brink of a massive bullish breakout? Let’s break it down.
💎#SHIB is showing promising signs of bullish momentum after successfully breaking out of a reversal pattern with a strong green candle. If SHIB can push through the key resistance level around 0.000021, we could see a clear confirmation of the bullish trend in the short term, potentially hitting our target at the next strong resistance level.
💎However, if SHIB struggles to break the resistance at 0.000021, there is still an opportunity to catch it on a retest of the support zone at 0.0000143. This area presents a high-probability buying opportunity, as the price could rebound and resume its upward trajectory.
💎But beware, if SHIB fails to hold the support at 0.0000143 and breaks below, this would signal a dangerous shift. A daily candle close below the support would confirm a bearish trend, leading to a potential fall back into the demand zone. At that point, the bullish scenario would be invalidated, and we’d be looking at a possible longer-term downtrend.
Remember, Paradisers, disciplined and patient trading is the key to long-term success.
MyCryptoParadise
iFeel the success🌴

SHIB on the Move up! Shib just cleared a significant resistance level, and the chart shows a clear uptrend. Moving averages are crossing, suggesting more upward pressure in the short term.

SHIB: Struggling to Break Key ResistanceSHIB has shown a consolidation pattern in the last several hours, trading at $0.00001365, with both the 1H and 4H data indicating weak momentum and slight bearish tendencies. Recent whale activity and general meme-coin market interest have supported SHIB’s price, but technicals show a need for stronger momentum to push the price higher.
1H Chart Breakdown: Weak Momentum and Consolidation
On the 1-hour chart, SHIB has been hovering near its Bollinger Band Basis of $0.00001376, unable to gain significant bullish momentum. The RSI at 38.52 signals a slightly oversold condition, while the Stochastic Oscillator (%K at 3.85) is deep in oversold territory, hinting at a potential short-term bounce. However, the MACD is flat, and the ADX at 11.46 indicates a weak trend, suggesting the price might remain in a tight range unless there’s a volume spike.
Resistance: $0.00001387 (Upper BB)
Support: $0.00001365 (Lower BB)
4H Chart Breakdown: Bearish Momentum Building
The 4-hour chart is showing more caution, with SHIB sitting slightly below the Bollinger Band Basis ($0.00001369). The RSI at 49.70 is neutral but points toward a weakening bullish trend, while the Stochastic Oscillator (%K at 25.76) is still in oversold territory, suggesting potential for a brief upward correction. However, the MACD histogram is negative, indicating growing bearish momentum, while the ADX at 12.22 suggests the trend is still relatively weak.
Resistance: $0.00001411 (Upper BB, Parabolic SAR)
Support: $0.00001327 (Lower BB)
Support and Resistance Levels (Across Timeframes):
Immediate Resistance (1H & 4H): $0.00001387 - $0.00001411 (Upper BB, SAR level)
Immediate Support: $0.00001327 - $0.00001365 (Lower BB)
Actionable Strategy: Range-Bound Trading with Weak Momentum
Bullish Scenario:
If SHIB breaks above $0.00001387 (1H Upper BB), it could attempt a push toward $0.00001411 (4H resistance and SAR level). For traders seeking quick entries, look for a bounce confirmation with rising volume.
Bearish Scenario:
A failure to hold support at $0.00001365 could see SHIB testing the $0.00001327 level (Lower BB on 4H), and a break below this could open doors to more significant downside toward $0.00001280.
Action Point: Given the weak ADX and neutral momentum, consider range-bound trading strategies, setting tight stop-losses around $0.00001327 and aiming for modest profit-taking near $0.00001387.

Will Shiba Inu make it to 1360 zone?Will Shiba Inu make it to 1360 zone?
Will CRYPTOCAP:SHIB make it to 1360 zone?
This girl needs some more buy pressure to ride it to that northern level.
These are some zones I am looking at

SHIB USDT - FRACTAL Shows Bullish Impulse NextMany altcoins are currently in Accumulation Phase and/or approaching great buy zones. This is the part of the cycle where there seems to be very little action, and the price moves in a range and sideways.
It's safe to say that we can expect sideways/range trading until BTC moves the market. In a previous update, I mentioned how it is crucial to watch not only BTC, but BTC.D and the TOTAL3 market for the next move:
The good news, is that this makes for an excellent time to BUY back into any market. The lowest risk option here would require some patience though, because the accumulation cycle often lasts month. Luckily - we are already a month in of mostly range trading.
Here's a look at another altcoin that's possible worth buying - RNDR, which is now approaching a great zone to buy-back :
__________________________________
BINANCE:SHIBUSDT

Shiba Inu bulls fail: here's whyShiba Inu (SHIB), a leading meme coin, has been trading within a horizontal range since August 8. While it briefly surged past the upper boundary of this channel, it failed to sustain the breakout and dropped back below resistance on August 28.
Following this, SHIB moved toward the channel’s lower boundary, which acted as support. However, the coin has now broken below this key level, signaling increased selling pressure and the likelihood of further declines in SHIB’s value.
A market is said to be in consolidation when an asset trades within a horizontal channel, meaning its price moves within a defined range for a period of time. The upper boundary of this channel represents resistance, while the lower boundary acts as support.
In the case of Shiba Inu (SHIB), this consolidation saw the asset facing resistance at $0.000014, while bulls provided support at $0.000012. This sideways movement highlighted the balance between buying and selling pressures in the SHIB market, preventing the coin’s price from making a strong move in either direction during this period.
If Shiba Inu (SHIB) retests its recent breakout and successfully reverses, it could signal the start of a new uptrend. With sufficient buying pressure, SHIB’s price might rally toward the resistance level of $0.000014 and potentially break above it.
If this occurs, the meme coin could aim for the $0.000018 mark.
However, if the current downtrend persists, SHIB’s value could face a further 23% drop, bringing it back to its August 5 low of $0.00001. This scenario would indicate a deeper bearish outlook, with selling pressure continuing to weigh on the coin’s price.

SHIB ANALYSIS🔮 #SHIB Analysis 💰💰
🌟🚀In daily chart we can see a formation of "Falling Wedge Pattern" in #SHIB. Currently #SHIB falls from its descending trendline. If #SHIB breaks and holds this pattern then we will see a huge bullish move.💲💲
🔖 Current Price: $0.00001440
⏳ Target Price: $0.00002050
⁉️ What to do?
- We have marked some crucial levels in the chart. We can trade according to the chart and make some profits in #SHIB. 🚀💸
#SHIB #Cryptocurrency #DYOR #PotentialBreakout

DJI 8/26~30 LONG Forecast
1D Chart / LONG
Technical Grounds
-NV > +250M
-TV Strong buy
-LinReg Pearson <0.95
-Pivots HL still Long-Green
-LinReg > 90 degrees (uptrend)
-Reverse Head & Shoulders Formation
-NV shows a declination trend of negative bars
-Price crossed up SMA100, SMA20 & LinReg Mid Line
-Price crossed up index resistance on past Aug 15th
-Price level far from cyclic ending point of Sep 13th
-POLITICAL FACTOR: Elections coming / +Media Influence
-Fed announcing interest rate cuts (as political influence in elections / investors mindset)
SHIBUSDT / LONG ....

MAGIC DUOS NEWS Aug 23, 2024 1D CHART UpdateRECOMMENDATIONS For Very Very Low Capital Investors
SHIBUSDT Crypto / Now at 0.00001521
Go LONG! Price crossed SMA 20, NV is positive showing 3.317T and Privot HL continue going up in GREEN. Close position once Privot HL turn RED.
SH Proshares Short S&P500 / Now at 11.15
Go LONG once Privot HL turn GREEN.
If that happens DJI and SPY will go in the opposite direction. Yes, DOWN.
Remember, all these metrics came from 1D Charting.
FOLLOW THEM UP TWO TIMES DAILY, AT 10AM & 10PM EST
Your COINS will be appreciated!!!
