SHIBUSDT Breakout and Potential RetraceHey Traders, in today's trading session we are monitoring SHIBUSDT for a selling opportunity around 0.00001630 zone, SHIBUSDT is trading in a downtrend and curently is in a correction phase in which it is approaching the trend at 0.00001630 support and resistance area.
Trade safe, Joe.
SHIBUSDT
SHIB/USDTIts good for spot!
A memecoin that all of you know it!
2 step is logical for buying according to DCA !
stoploss will be activated if daily close seen under the last step...

SHIBUSDT.1DUpon analyzing the daily chart for SHIB/USDT, I have identified several critical elements that provide insight into the current market condition and potential future price movements.
Technical Analysis Observations:
Support and Resistance Levels (S1, R1, R2):
Support Level 1 (S1): At approximately $0.00001057, this level has been a significant support zone. It marks a crucial floor that, if breached, could signal further declines.
Resistance Level 1 (R1): Positioned at $0.00002019, this is the immediate resistance level. A break above this could indicate the start of a bullish correction.
Resistance Level 2 (R2): Located at $0.00003000, this higher resistance level would be a more extended bullish target.
Trend Indicators:
The descending trendline marked by R1 and R2 highlights the overall bearish trend. A break above this trendline would be a strong indicator of a potential trend reversal.
The recent price action shows the price testing lower support levels, indicating persistent selling pressure.
RSI (Relative Strength Index):
The RSI is currently at 39.62, suggesting that while the asset is not in the oversold territory, it is approaching levels where a reversal could be expected if buyers step in.
MACD (Moving Average Convergence Divergence):
The MACD lines are below the signal line, and the histogram is negative, indicating ongoing bearish momentum. However, the MACD lines are flattening, which could suggest a potential reduction in bearish momentum and an upcoming crossover.
Conclusion:
The SHIB/USDT pair is at a critical juncture, testing significant support at $0.00001057. The RSI nearing oversold levels and the flattening MACD suggest the possibility of a short-term rebound. However, the prevailing bearish trend underlined by the descending trendline and MACD requires caution.
For trading strategies, one could wait for a confirmation of reversal signals, such as a bullish RSI divergence or a MACD crossover. A break above the immediate resistance at $0.00002019 would provide a stronger confirmation for a bullish reversal, targeting $0.00003000. Conversely, a break below the support at $0.00001057 would indicate further downside, necessitating close monitoring for new support levels.
Implementing risk management strategies, such as setting stop-loss orders just below the support levels and taking profits near resistance levels, is crucial in managing potential risks and optimizing gains in such a volatile market. Monitoring external market factors and news that could influence price action is also essential.

Potential Bullish Reversal for SHIB Shiba InuIf you haven`t bought SHIB before the breakout:
Nor sold the top:
Now upon analyzing the chart pattern of SHIB Shiba Inu, it appears that a falling wedge formation is currently in play. This pattern is characterized by converging trendlines sloping downward, with a series of lower highs and lower lows. In technical analysis, a falling wedge is typically interpreted as a bullish reversal pattern.
The falling wedge on SHIB suggests that despite recent declines, there is potential for a bullish breakout. As prices continue to oscillate between narrowing support and resistance levels within the wedge, there is anticipation among traders and investors for a potential upward movement. This pattern often signals a gradual weakening of selling pressure and a potential shift towards buyers gaining control.

SHIBUSDT Technical Analysis in Daily Timeframe.Hello everyone, I’m Cryptorphic.
For the past seven years, I’ve been sharing insightful charts and analysis.
Follow me for:
~ Unbiased analyses on trending altcoins.
~ Identifying altcoins with 10x-50x potential.
~ Futures trade setups.
~ Daily updates on Bitcoin and Ethereum.
~ High time frame (HTF) market bottom and top calls.
~ Short-term market movements.
~ Charts supported by critical fundamentals.
Now, let’s dive into this chart analysis:
SHIB/USDT is currently experiencing bearish momentum within a descending parallel channel. Key support lies around the historical support level and the channel's lower boundary.
The RSI indicates that the asset is oversold, suggesting a possible reversal or a corrective bounce in the near term.
Key Elements
~ Trend Channel: Descending channel with lower highs and lower lows, indicating bearish momentum.
~ Support: Initial support around the $0.000017000 area, tested multiple times, and lower support at $0.000013000.
~ Moving Average: Hovering around the 200-day moving average is crucial for potential resistance. A breakout above this resistance will likely indicate a rally toward $0.0000234.
~ Bullish Divergence: RSI is crucial at 31.12 in oversold territory, with potential bullish divergence suggesting a possible trend reversal.
Best entry for spot holding on SHIB: $0.000015 to $0.000013.
Mid-term Targets: $0.0000262 to $0.000043.
DYOR. NFA.
Please hit the like button to support my content and share your thoughts in the comment section. Feel free to request any chart analysis you’d like to see!
Thank you!
#PEACE

SHIBUSDT.1DThe SHIB/USDT pair, as shown on the daily chart, trades at $0.00001655, demonstrating a significant bearish trend with a recent decline in value by approximately 5.59%. The trading environment has been largely bearish over the past months, following a failed breakout above earlier resistance levels.
Key Support and Resistance Levels:
Resistance 1 (R1): $0.00002155 - This level marks a recent high that SHIB failed to surpass, forming a clear resistance zone.
Support 1 (S1): $0.00001413 - This is a critical support level where previous lows have converged, potentially serving as a stabilization point if bearish momentum continues.
Technical Indicators:
MACD: The Moving Average Convergence Divergence (MACD) is currently below the signal line and has moved into negative territory, indicating increasing bearish momentum.
RSI: The Relative Strength Index (RSI) is at 31.71, nearing the oversold territory, which may suggest that SHIB is under substantial selling pressure but could also indicate a potential reversal if it moves further into oversold conditions.
Analysis Conclusion:
The current technical setup suggests that SHIB is experiencing strong bearish pressure, with the potential for further downside if it breaks below the support level at $0.00001413. The proximity of RSI to the oversold region might slow down the selling momentum, possibly leading to a short-term bounce or consolidation. However, unless SHIB can reclaim higher levels above the current resistance at $0.00002155, the overall market sentiment remains bearish.
Investors should watch for any movement that breaks out of the current trading range as a signal for potential trend reversals or continuations. Given the negative momentum indicated by the MACD and the critical support levels outlined, the strategy should be cautious, prioritizing risk management and staying alert for any signs of a change in market dynamics.

SHIB/USDT Analysis: Key Levels to BUY (READ CAPTION)By analyzing the #Shiba chart on the weekly (logarithmic) time frame, we can see that after a significant rally, this cryptocurrency has undergone a correction. We should soon expect the end of this correction and the start of the next upward wave. Keep an eye on these levels: 0.00001542, 0.00001385, and 0.00001248! Additionally, the price might fill its previous FVG before starting a strong upward move. This analysis will be updated!
Please support me with your likes and comments to motivate me to share more analysis with you and share your opinion about the possible trend of this chart with me !
Best Regards , Arman Shaban

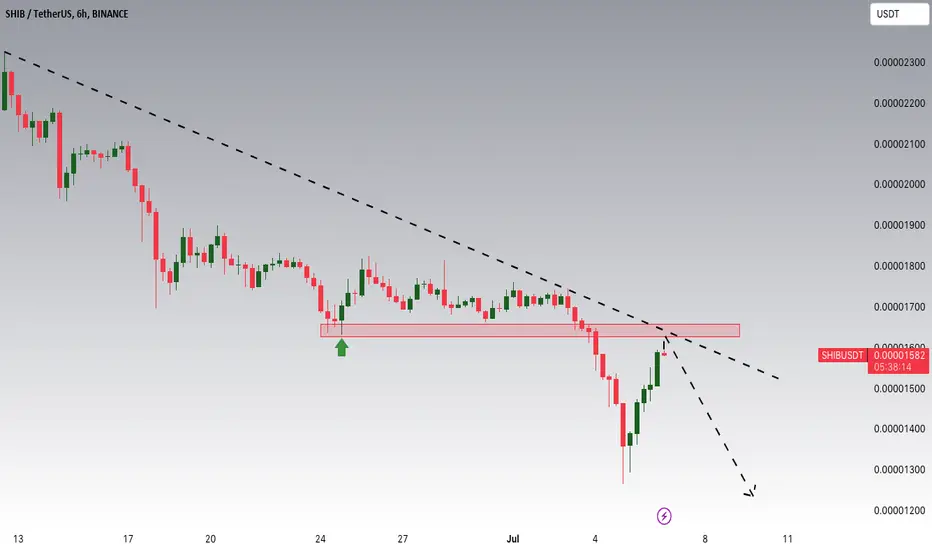
SHIBUSDT Is Approaching The Down TrendHey Traders, in today's trading session we are monitoring SHIBUSDT for a selling opportunity around 0.00001870 zone, SHIBUSDT is trading in a downtrend and currently is in a correction phase in which it is approaching the trend at 0.00001870 support and resistance area.
Trade safe, Joe.

SHIB - This Indicator says SELLSHIB has just flashed a dangerous "SELL" alert.
This indicator is highly accurate in higher timeframes, especially the weekly. Look at all the "SELL" signals and how far the price drops after:
From a trendline perspective, SHIB HAS to stay ABOVE the current support line (Fibonacci line 0.236). If it falls under, SHIBA will be at risk of falling to the dotted line, which is BEARISH.
In case you missed it, my take on Bitcoin for the SHORT TERM:
________________________
BINANCE:SHIBUSDT

it's the time to start the BULLRUN for SHIBA INUBINANCE:SHIBUSDT finished the wave 4 of Elliott 5 waves & now we are at the start of wave 5 & targets on the chart.
Let's start the BULLRUN for SHIBA INU

SHIBUSDT.1DIn this technical analysis of the SHIB/USDT daily chart, we explore the recent price movements and use key technical indicators to forecast potential future trends.
Key Observations:
Current Price and Recent Movement:
SHIB/USDT is trading at a price of $0.00001854, showing a moderate increase of 2.49% today. This suggests a possible change in market sentiment or response to external stimuli.
Support and Resistance Levels:
R1 (Resistance Level 1): $0.00001825 - It's noteworthy that the current price has surpassed this level, indicating a potential new support if the price sustains or advances further.
R2 (Resistance Level 2): Marked on the chart but not numerically identified, this would be the next target for bullish momentum.
S1 (Support Level 1): Marked around a previous low (exact value not visible), serving as the primary support area to watch if a reversal occurs.
Technical Indicators:
MACD (Moving Average Convergence Divergence): Currently below the zero line but the histogram suggests decreasing negative momentum, indicating a possible bullish reversal in the making.
RSI (Relative Strength Index): At 31.26, it's nearing the oversold territory, which might attract buying interest as traders perceive it as undervalued.
Analysis and Conclusion:
The current trading pattern in SHIB/USDT reflects a slight bullish recovery, indicated by the price crossing above R1. If the market sustains this rally, R2 could be the next logical target. The improving MACD, moving from deeper negative territories towards the baseline, supports this bullish outlook as it often precedes a change in trend.
However, the RSI near the oversold boundary suggests that while immediate selling pressure might be subsiding, caution is still warranted. A retest of the new support level at R1 (previously R1 resistance) could confirm its reliability for maintaining the upward momentum.

Monthly Chart path for BTC 👩🚀HalvingIt's been a long while since I posted one of these so here goes!
This is an updated monthly overview on the idea path for the Halving event, many people have their opinion and they have some great points to where it may or maynot be headed. So here is my entry to where it may likely start the full process for the halving to work it's way to the 120k or 200k range.
Please be respectful in the comments and happy trading.
It took sometime to create the paths for it but here is my thoughts on the event, expect to drop as low as 50k to 45k up until june 1st. that's when the possible buildup for the event will take place. the market has to count all the orders but likely they'll be some great resistance to prevent further bleed-out but likely will fall to the 50k BTC - .00001200 for shib, before suddenly skyrocketing to the 70 - 80k or 90 to 120k as told by the events amount to be expected is 120k.
Note: it will either sit there for a short time before falling back to the 80k - 60k - range while resistance will be present the price correction will be a straight flat line to the lows of possible 20k to 10k BTC levels. this is due to Whales making a "sell all play" on BTC and shib cashing in on the millions obtained, and much of the market will likely do the same, as they see a new type of crypto winter. take over the market until early september 2025.
This is only speculation but this is also from experience with both cryptos the whales will make that sell-off happen and it will be painful to everyone holding come sept 9th this year.
So buy which crypto you want around June or now if you like, hold for the time being and wait for the event to build from the fresh entry it takes about a month or even two months to see results.
The only thing that could delay or derail this - would be if the Federal Reserve Bank decided to do price hikes within the months of June and October 2024, hopefully that won't be the case.
BTC WEEKLY CHART Halving event.
I hope this helps answer any of your questions.

SHIB ANALYSIS🔮 #SHIB Analysis 💰💰
🌟🚀 As we can see that there is a breakdown of descending triangle in #SHIB. There is a support level at $0.00001902, it will first retest its support level then after that we would see a reversal from support level . 🚀🚀
#SHIB #Cryptocurrency #DYOR

SHIB Daily LongIt seems that CRYPTOCAP:SHIB can correct up to the specified range. The market has taken a corrective downward trend in recent days and there is no good reason for the market to become bullish. What it seems is that this time and price break is necessary for the market to continue its upward trend.

SHIB: buy📊Analysis by AhmadArz:
🔍Entry: 1875
🛑Stop Loss: 1728
🎯Take Profit: 2009 - 2137 - 2334
🔗"Uncover new opportunities in the world of cryptocurrencies with AhmadArz.
💡Join us on TradingView and expand your investment knowledge with our five years of experience in financial markets."
🚀Please boost and💬 comment to share your thoughts with us!

$SHI / USDT bullish wave coming soon. Be ready!CRYPTOCAP:SHIB is in a bullish pennant flag that is about to break out to the upside. It is a beautiful flag with a huge pole, perfectly executed.
The Fibonacci retracement is giving us the target price (TP) with 100% potential.
Just follow the chart; it is pretty obvious. The Stochastic RSI is about to pump on the daily chart.
Everything is aligned for a bullish wave.
DYOR (Do Your Own Research), as anything can happen. This is my personal opinion, not investment advice.

Shiba is currently well-positioned for growthIn the daily chart of Shiba, positive divergence is visible across multiple indicators. This suggests that Shiba is in an excellent position to experience significant growth from this area. Positive divergence occurs when the price makes lower lows, but indicators like RSI and MACD make higher lows, signaling weakening bearish momentum and a potential upward reversal.
Shiba is currently well-positioned for growth. If Bitcoin and the broader market conditions remain stable, Shiba could see considerable growth from this range.

Shiba Inu (SHIB): where to next? | 10.06Shiba Inu has failed to hold the 100 EMA support level and has opened below it during this trading session. The fact that the price of the meme token is moving below this moving average raises substantial concerns and may be a negative signal for investors. The next support level for the asset is not far away but is located below a crucial resistance level.
The Shiba Inu chart shows a bearish trend as it tries to stabilize above the 100 EMA. If selling pressure gets more intense, the price may approach the next major support at $0.000019, as indicated by the break below this support level.
For SHIB this area will be crucial because it has the potential to either provide a base for a rebound or, in the event that it is breached, to cause further declines. There are bearish signals being displayed by technical indicators such as the RSI. The fact that the RSI is currently in close proximity to the oversold area suggests that the selling pressure might continue.
Nevertheless, if buyers intervene to take advantage of the lower prices, the oversold situation also creates the chance of a brief rebound. The volume profile indicates a decline in trading activity in comparison to earlier sessions. In a downtrend, lower volume usually signals waning buying interest, which may make it difficult for SHIB to stage a significant comeback anytime soon.
A more pessimistic outlook for the meme token is further supported by the declining volume, which suggests that investors are distancing themselves from the token. A rebound may be imminent if SHIB is able to maintain this level and show signs of strength, suggesting that the worst of the selling may have passed.
WHITEBIT:SHIBUSDT

SHIB ANALYSIS (4hr)🚀#SHIB Analysis : Pattern Formation
🔮As we can see in the chart of #SHIB that there is a formation Head And Shoulder Pattern and it's a bearish pattern. If the candle retests the neckline then we would see a little dump in #SHIB📊
🔰Current Price: $0.00002340
🎯 Target Price: $0.00002060
⚡️What to do ?
👀Keep an eye on #SHIB price action. We can trade according to the chart and make some profits⚡️⚡️
#SHIB #Breakdown #Cryptocurrency #TechnicalAnalysis #DYOR

$SHIB TO THE MOON ?👨🏻💻 CRYPTOCAP:SHIB
#SHIB had a quick dip below the support line to trigger stop losses, but is now showing a strong upward movement👀
We'll have to wait and see if the price can break through the descending resistance, as the next move will be decided by a break of the triangle pattern📈
- - - - - - - - - - - - - - - - - - - - - -
Follow #CryptoEase and Share it With Your Crypto Mate 😉
BINANCE:SHIBUSDT

SHIBUSDT Scenario to earn 5x price growth / (Memecoin Basket)BINANCE:SHIBUSDT
COINBASE:SHIBUSD
Hello Traders
SHIB is one of my suggestions for the altcoin market (Memecoin Basket).
Highly potential for the alt rally season.
The best strategy for altcoins is to allocate a certain percentage of assets (for example, 10% of the total portfolio) to buy potential altcoins.🎲
As the alt-season rally approach, the demand for meme coins will increase continuously.

SHIB: buy in best level📊Analysis by AhmadArz:
🔍Entry: 2425
🛑Stop Loss: 2244
🎯Take Profit: 2606 - 2808
🔗"Uncover new opportunities in the world of cryptocurrencies with AhmadArz.
💡Join us on TradingView and expand your investment knowledge with our five years of experience in financial markets."
🚀Please boost and💬 comment to share your thoughts with us!

TRADE The CHOP: 3 Ways to Make ATLEAST +15% Choppy markets are identified by low volume and sideways trading / range trading. It seems uninteresting in most cases, but you don't have to sit around and wait for the next big impulse wave!
Here are three plays YOU can take during choppy markets:
1) 4H : Short Resistance
Chop trading can be a blessing - the price often touches the same support zone and the same resistance zone 2 - 3 times, before breaking out either way. This means that if you spot your zone early, you could take a short timeframe swing trade. Another way to find a trade is to look for gaps in the candles:
2) 4H : Long Support
South Africa is in a time of turbulence, and the Rand is weak as the country anticipates who will join forces to govern in the next two weeks. Analysts are expecting the Rand to hit R20 per USD as investors shy away from uncertainty.
But we can keep it modest and low risk with a 10x TP at R19 😉
3) Daily : SPOT Hold to TP Zone
Nothing like a classic low risk trade - but you may need some patience with it! If you're not willing to look at charts all day, or have alarms wake you up at 2:30am to take a trade then this is your style.
_______________________________
FX:USDZAR POLONIEX:SOLOUSDT NASDAQ:PYPL BINANCE:SHIBUSDT
