SHIB TM : 1hHello traders.
I hope you doing well.
These areas are based on my personal strategy and I will share it with you.
Open a sell position on the supply area or open a buy position on the demand area.
Your entry point, stop loss, and target point are based on money management and the amount of money in your trading account.
But I promise you that by trading in the areas of my trading strategy, you will definitely make a profit, because these areas, although they seem simple, are my experience of 8 years of learning and trading.
I hope you will achieve maximum continuous profit with me by using supply and demand areas.
Good luck traders.
Mohammad Goodarzi
SHIBUSDT

💎 SHIB/USDT (Shibainu) : Ready for another Bullish move? (READ)By analyzing the #Shibainu chart in the weekly timeframe, we can see that since the last analysis (2 years ago) until now, this cryptocurrency has grown by more than 350%. This growth is mainly due to two consecutive weeks of pumping, which caused the price to rise to 0.000045. Currently, the price is trading around 0.000025, and I expect that with stabilization in this range, we will see another upward movement. However, note that with the recent growth, Shiba has created a large FVG (Fair Value Gap) that I expect to be filled in the long term. The first probable target for this cryptocurrency is 0.000045.
Please support me with your likes and comments to motivate me to share more analysis with you and share your opinion about the possible trend of this chart with me !
Best Regards , Arman Shaban

SHIB flips Cardano in market cap. What's next? | 29.05The SHIB price has been trading in an ascending manner for a while, as the lower trend line has been acting as a strong support. The recent volatility that kicked into the space, caused the price to print consecutive bullish candles that lifted the levels within the resistance of an ascending triangle. Although a breakout attempt has occurred at the moment a bullish close above the zone may validate the upswing.
Moreover, the price has reached the upper range of the Gaussian Channel and a close above these levels may trigger a fresh bullish case. On the other hand, the RSI is ascending, suggesting the price may remain elevated and reach the upper resistance zone between $0.00003 and $0.000032. To do so, the buying pressure is required to increase with a rise in the trader’s activity, which could attract more liquidity.
Therefore, it is very crucial to monitor the Shiba Inu (SHIB) price action until the day’s close, as a small mistake may cause a breakdown. A daily close within or below the resistance zone can validate a bearish momentum, which may potentially lead to further downward movement.
WHITEBIT:SHIBUSDT

SHIB/USDT Ready For a Breakout From Descending Triangle👀🚀💎#SHIBUSDT is tracing a Descending Triangle pattern and we expect a bullish breakout from this.
💎The horizontal support level has been tested multiple times. The 200 moving average highlights a bullish trend. A definitive breakout from the triangle pattern is essential to confirm a bullish move.
💎When it breaks free, we'll closely monitor a retest to validate the breakout before executing our strategies. If #ShibaInu maintains the support at $0.00002068 and rises, we aim for the resistance zone we've outlined.
💎However, if #SHIB fails to hold this support and slips back into the pattern, it may indicate a weakening bullish trend. In this case, the price could fall to the next significant support level at $0.0000182.
💎Previousally, CRYPTOCAP:SHIB has shown a robust ability to rebound from this level. If this pattern persists, a strong recovery could be in play. Nevertheless, a decisive break below this support would shift our bullish perspective towards a more bearish outlook.
MyCryptoParadise
iFeel the success

SHIB Long Trade SetupCurrent Situation:
Pattern: SHIB is showing signs of long accumulation, which typically precedes an explosive upward move.
Trade Strategy:
Entry Point: Enter a long trade above $0.00002739.
Take Profit Targets:
First Target: $0.00003267
Second Target: $0.00003960
Third Target: $0.00004440
Stop Loss: Set at $0.00002550 to manage risk.
Summary:
SHIB's historical pattern of explosive moves after long accumulation periods suggests a good opportunity to build a position. Entering a trade above $0.00002739 aims to capture the potential upside. Take profit targets are set at $0.00003267, $0.00003960, and $0.00004440, while a stop loss at $0.00002550 helps to limit potential losses.

Adam and ShibAdam and Eve pattern forming during accumulation phase of Shib
Curious to see what others think about this.
This is the closest I have seen to this formation in any of the alts on the long list.

DOG ALTSEASON Incoming🙀 Doge, Shib, Babydoge, Dog - BIG PUMPSWHEN to BUY 4 DOG COINS in 5 minutes 🐱
The cryptomarket is currently waiting on direction from BTC. From my previous analysis, we've concluded that BTC is currently trading in Elliot Wave 3-4 - meaning we're still waiting for the final impulse wave up 4-5. And when this happens, you better be ready with your positions.
More on why the ATH for BTC is not in yet :
Other altcoins I'm watching for x10 increases this year:
_________________________________
GATEIO:DOGUSDT MEXC:BABYDOGEUSDT BINANCE:SHIBUSDT BINANCE:DOGEUSDT

SHIBUSDT: Two Possible Areas for Swing Buy. Dear Traders,
We have two possible buying opportunites on SHIBUSDT price is currently accumulating and if price do not decide to manipulate then we can see strong price rebound from current price region. However, if price manipulate then we can see it going down to our second entry there we have imbalance zone which will filled and can see strong bullish rebound.
**Like and comment our ideas which will support us to bring you more educational ideas and our views on all financial instruments**
Team SetupsFX_

SHIBUSDT#SHIB CRYPTOCAP:SHIB has broken the downtrend, sustained above the resistance, and completed the retest. This gives us a bullish signal. We can position ourselves accordingly.

Shiba Inu SHIB: Eyes Set on ResistanceSHIB is trying to push up from $0.00002155, hinting at upward potential.
Exceeding $0.00002611 could trigger a bullish surge towards $0.00003147, while a drop below $0.00001910 might recalibrate support to $0.00001619.

SHIB/USDT: Potential Breakout and Retest - Trade Idea!!Hey everyone! If you find this content valuable, please consider giving it a thumbs up and following for more analysis.
SHIB is showing some interesting signs on the chart. We've seen a potential breakout from a previous resistance level, and the price is currently retesting that level as support. Additionally, the 100-day moving average (100MA) is acting as potential support.
This could be a buying opportunity for those interested in SHIB. However, it's important to manage your risk. Here's a possible trade setup:
Entry: Current market price (CMP) with potential for adding more on a dip down to $0.000024 (be sure to use a stop-limit order for this)
Target: 80-100% potential profit (be sure to set realistic take-profit orders)
Stop-Loss: $0.00002225 (place a stop-loss order below the support level to limit potential losses)
Remember, this is just an idea, and the market can be unpredictable. Always conduct your own research before making any trading decisions. What are your thoughts on this SHIB setup? Share your analysis in the comments below!

I Cannot SHORT This !!!Hi.
BINANCE:SHIBUSDT is following a Descending Triangle pattern and it has recently pumped from a horizontal support level.
The 200 moving average signals a bullish trend
A clear breakout from the triangle pattern is required to confirm a bullish move.
Stay awesome my friends.
_ _ _ _ _ _ _ _ _ _ _ _ _ _ _ _ _ _ _ _ _ _ _ _ _ _ _ _ _ _ _ _ _
✅Thank you, and for more ideas, hit ❤️Like❤️ and 🌟Follow🌟!
⚠️Things can change...
The markets are always changing and even with all these signals, the market changes tend to be strong and fast!!

SHIBUSDT 3D LONG📈Hi all. Timeframe 3D. SHIBUSDT has formed a triangle in 2 years and is in strong support. I am considering entering spot now and/or going long during a breakout/retest of the trend line. Marked goals and levels on the chart.

SHIB to 0.1Trend Line: The SHIB price is moving below a descending trend line. A breakout above this line could signal the beginning of an upward trend.
Support and Resistance: The price is currently testing the level around 0.025. A significant resistance level is visible around 0.070 and 0.100.
Indicators: The chart shows green and red arrows, which may indicate buy and sell signals. Given the last green signal, it suggests a potential price increase.
Trading Volume: Increased trading volume in the past indicates trader interest. If the volume increases during a price rise, it could confirm a bullish trend.
Prediction: If the SHIB price breaks above the descending trend line and successfully breaches the resistance level around 0.070, it is possible that it will continue to rise towards the value of 0.100. It will be crucial to monitor the breakout above the descending trend line and the price's reaction at the resistance levels.

Shiba Inu SHIB Update: Bulls vs. Bears - Which Will Prevail?There is a balance between bulls and bears in the daily chart of SHIBUSD.
A bullish move and a break-out of $0.00002611 will push price back to $0.00003147.
Above $0.00003147 is the next bullish rally zone rally zone.
A break-out of $0.00002155 will iwill push price lower to $0.00001910 and $0.00001619, the key daily support.

Shiba Inu SHIB: Intraday Trading Frenzy Unleashed!The chart highlights breakout/rejection points, criteria, and targets to execute on the trade opportunity.
Find more in the signature!

1000shib 4h Analysis1000Shib has done CHoCH on 4H time frame and shifted in trend from bearish to bullish. Now as its in bullish trend so we will look for buying oppertunities. I have marked poi for buying oppertunity. Current price is very good but a agressive entry. Second poi is very clean which is also marked on chart.

SHIBA - Buy here, do not miss next pump! (HUGE)Shiba Inu will definitely go higher later this year. Right now, we need to catch the bounce and ride the next wave to the upside. The 0.618 FIB retracement seems to be a great level to buy Shiba Inu, which is at 0.00002249. It's always important to do an Elliott Wave technical analysis for such pumps to stay in full picture. We need to see the full market structure and map of the uptrend. I suggest waiting for a bullish flag or any bullish pattern, or just simply setting your limit order to buy SHIB lower! I am very bullish on this coin, and the next profit target is 300% away!
What Is SHIBA INU (SHIB)?
SHIB is a decentralized, community-led currency held by millions across the globe. Since its inception in late 2020, the Ethereum-based SHIB token has grown to become a worldwide phenomenon, and is now accepted as a form of payment at hundreds of locations, either directly or through third-party intermediaries.
Shiba Inu coin was created anonymously in August 2020 under the pseudonym "Ryoshi." Ryoshi says about himself that he is a nobody and not important and that the efforts to unmask his identity, even if successful, would be underwhelming.
This meme coin quickly gained speed and value as a community of investors was drawn in by the cute charm of the coin paired with headlines and tweets from personalities like Elon Musk and Vitalik Buterin.
Since release SHIB now trades on the ecosystem's proprietary DEX, ShibaSwap.

Shiba Inu SHIB Intraday Trade SetupThe chart highlights breakout/rejection points, criteria, and targets to execute on the trade opportunity.

Triangle Pattern formed & Breakout, Next Kill 2 to 3 zerosIn SHIB/USTD, Triangle Pattern formed and Breakout. I have attached 3 images, before Breakout the Triangle Pattern and during the Breakout Triangle Pattern. Now SHIB in retracement phase, after completing the retracement, SHIB will continue its Up Trend and reach the "Previous High". Then SHIB will likely remove 2 to 3 Zeros. I have been continuously following SHIB for the last 3 years.

SHIBUSDT#SHIB CRYPTOCAP:SHIB has formed a very promising chart pattern for us. It has broken the resistance of the wedge formation, confirming the bullish momentum. One of the best indicators, TD Sequential, has given a bullish signal after a long time. Successively, it is expected to reach Fibonacci targets at 0.61, 0.78, and 1 levels. Since #dogecoin has already started its uptrend, #shibcoin is likely to follow suit.

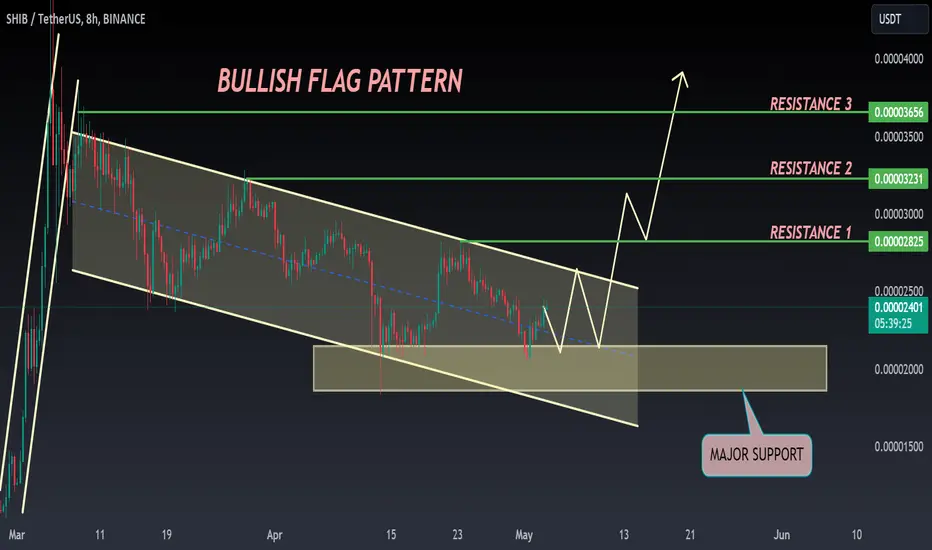
SHIB ANALYSIS🔮 #SHIB Analysis
🌟₹SHIB is consolidating in a Bullish Flag Pattern in 8hr timeframe. Incase of successful breakout in #SHIB we can expect solid bullish wave expecting 50-60% bullish wave 💲
🔖 Current Price: $0.00002396
⏳ Target Price: $0.00003656
⁉️ What to do?
- We have marked crucial levels in the chart . We can trade according to the chart and make some profits. 🚀💸
#SHIB #Cryptocurrency #Breakout #DYOR
SHIB's Critical DipThis price point is closely approaching a critical support level at 2098, situated at the bottom of a previous gap, indicating a significant area where the asset might find a footing if the downtrend continues.
The current price is nearing the lower Bollinger Band, suggesting that SHIB is potentially entering an oversold territory. This could be a precursor to either a continuation of the bearish trend or a reversal if the asset is deemed too undervalued.
Volume: The trading volume is exceptionally high at 1.078 trillion SHIB, indicating significant market activity. Such high volume associated with a downtrend typically confirms strong selling pressure.
The price is below the SMA of 2207, signaling bearish momentum. Prices below the SMA generally indicate that the asset is currently in a downturn relative to recent price history.
The %K (10.2) and %D (11.6) values are below 20, which often suggests the asset is oversold and might either see a short rebound or continue to drop if the selling pressure doesn't ease.
At 26, the RSI further confirms that SHIB is oversold. This indicator often signals that the selling may be overextended, and a reversal could be imminent, depending on market conditions.
The MACD line below the signal line with a negative histogram value reinforces the strong bearish momentum observed in the market.
The chart indicates a robust resistance to upward movement, suggesting that any potential recovery may need significant volume and buyer interest to break past established resistance levels, particularly around 2552. With the market indicators pointing towards an oversold condition, investors should watch for potential stabilization or a minor price recovery. However, the overarching sentiment remains bearish, and caution is advised. This technical posture might offer a strategic point for traders to consider entry for a short position if expecting further decline, or to prepare for a possible buying opportunity should the indicators suggest a strong reversal is likely.
