SHIBUSDT hitthe 4h support area. Bounce in playSo the price hit finally the marked support area. And we see a bounce which was depicted in the last post.
The price will likely hit the 4h resistance at 0.00001476 level. The next course after the price hits that level will be decided by looking at the price action at that level.
Shibusdtanalysis

SHIBUSDT may pullback to closest 4h support areaPrice may tap this 4h support region in this pullback. But before this pullback, probably price might revisit0.00001544 level. Though current price level 0.00001526 is a good candidate for the next leg down to begin from here.
However during the pullback there is a little chance that it may miss that 4h support by a little 1% mark as there is hourly support there which might provide the bounce to the price a bit early than the marked 4h support region.
A better entry for a better R:R would be to wait patiently for the price to touch 4h support area.

SHIBUSDT current 30m candle to be red oneThe current 30m candle (UTC 10:30-11:00) has a higher probability of being a red one.

📈 Opportunity to Take a Short Trade on Shibusdt 💰🔍 Based on technical analysis, the Shibusdt chart on TradingView presents an opportunity to enter a 📉 short trade at 0.00001550. The target profit (TP) 🎯 is set at 0.00001140 and the stop loss (SL) 🛡️ is placed at 0.00001575. Investors are advised to consider this short trade as a 💡 potential opportunity in the current market conditions. 💹

SHIB Token Shiba Inu Coin Crypto Price PredictionAs you can see from 4h chart of SHIB Token Shiba Inu Coin price broke the resistance at around $0.00001278 now now when the price in future if it retest it we might see a good buying oppertunity.

SHIBUSDT current 4h candle higher probability to be red oneThe current 4h candle (UTC 08:00-12:00) has a slightly higher probability of being a red one.

Trading opportunity for SHIBUSDTBased on technical factors there is a Sell position in :
📊 SHIBUSDT
🔴 Sell Now 0.00000926
🧯 Stop loss 0.00000956
🏹 Target 1 0.00000887
🏹 Target 2 0.00000836
💸RISK : 1%
We hope it is profitable for you ❤️
Please support our activity with your likes👍 and comments📝

Trading opportunity for DOGEUSDTBased on technical factors there is a Short position in :
📊 SHIBUSDT
🔴 Short Now 0.00000916
🧯 Stop loss 0.00000982
🏹 Target 1 0.00000860
🏹 Target 2 0.00000764
💸RISK : 1%
We hope it is profitable for you ❤️
Please support our activity with your likes👍 and comments📝

#SHIB/USDT Still in Buying Zone, Here's Why.I still stand with my previous update.
This is the shakeout before Shib literally goes crazy.
This is what you see in the chart. It's a perfect retest after the breakout.
SHIB looks strong in HTF.
Best to get in around this level.
SL is still a daily close below 880.
DYOR, Not Financial Advice.
Please hit the like button and Share your views in the comment section.
Thank you
Cheers

SHIBA RECOVERY - BUY ZONE SET FOR SHORT/LONG BUYI have set up a new short - long term buy on SHIB/USDT.
Currently looking at an 'M' pattern, Shiba will hopefully take a fall to it's previous support as price couldn't hold it's trend line. This will take us to a major support where multiple bounces have been seen previously, especially for large upward trends long term.
Please feel free to provide your opinions and feedback on this trade and feel free to join me!
ATTENTION:
I AM NOT A FINANCIAL ADVISOR AND DO NOT TAKE ACCOUNTABILITY FOR YOUR DECISIONS BASED UPON MY ANALYSIS!

SHIBAINU Reversal aiming towards STARLINK.I applied this basic guide on FoRex trading on the SHIBUSDT weekly chart and this discovery is INSANE!!!! After this weeks candle the reversal got real and serious. Get ready to just teleport to 2800 range without anybody stopping us. DONT MISS OUT :)

SHIB/USD Downtrend BreakoutThe idea here is about SHIB/USD:
My view is short term Bullish for the below observed technical factors.
Points as per TA on Weekly & daily Chart:
1. Broken out of Downtrend Channel as per below:
2. Possible Double Bottom pattern formation on a weekly chart await for neckline breakout as per below:
3. Possible Bearish Bat Harmonic Pattern CD leg in formation as per the published chart .
4. Bearish Cypher pattern completed on Daily chart, Target 1 Achieved & support confirmed at the time of publishing as per below :
5. Trading below 20 EMA on a weekly chart & above 20 EMA & below 200 EMA on a daily chart.
6. Ichimoku Cloud analysis: Kumo Breakout & Kumo Twist on a daily & weekly is Neutral at the time of publishing.
7. RSI is at 47.07 on a weekly Chart and 68.27 on daily chart at the time of publishing.
8. MACD above signal line on weekly & daily chart.
9. Hull Moving average on daily is a sell and Strong buy on Weekly & monthly.
10. ADX ( Average directional index ) trend strength is at 8.2 on a weekly which indicates a absent or weak trend ( ADX between 0-25 is a Absent or weak trend) & 43.17 on daily chart which indicates strong trend.
Projected Target with %: Double bottom & bearish Bat targets are almost aligned at the same point.
A). Conservative entries can wait for retest & neckline breakout confirmation on weekly chart for double bottom, target provided in chart.
B). Bearish Bat target provided in chart.
Stop Loss: provided in chart.
Disclaimer: “The above is an Educational idea only and not any kind of financial or investment advice. So
Please do your own DD (Due Diligence) before any kind of investment”.
Do you like my TA & ideas!!
Want to keep yourself updated with current market action? Then don’t forget boost & to subscribe for more analysis.
Do leave your valuable feedback & comments for any improvisations.
Cheers.

SHIB (bullish flag)SHIB / USDT
Price is already made a breakout from massive ten months descending channel in last August and forming a bullish flag above it
A breakout from this flag to upside will trigger a bullish movement up to 0.00002000$
A Local support of 0.00000980$ must hold to remain bullish

shiba signalentry : 0.00001033
sl: 0.00001013 (1.94%)
tp: 0.00001212(17.33%)
believe me
shiba ready to pump
also crypto markt ready to pump

SHIB/USDT #SHIB/USDT looks awesome, I quickly do an analysis for #scalp, I hope it'll help you. the targets are mentioned in the chart, good luck.

SHIB Coin 2022 $ Target the current support that we should hold is above 0.00000911$, cause if we didn't hold it , we going to see huge sell off till the bottom price for this year above the 0.0000058$, and we going to have a bullish momentum once we clear the 0.000018$+ resistant level.and make our 0.0000091 our bottom .

SHIB/USDT #Signal #scalp #trade
SHIB/USDT Liquidity grabbed! now its time to buy it, the targets are mentioned in chart, Good luck


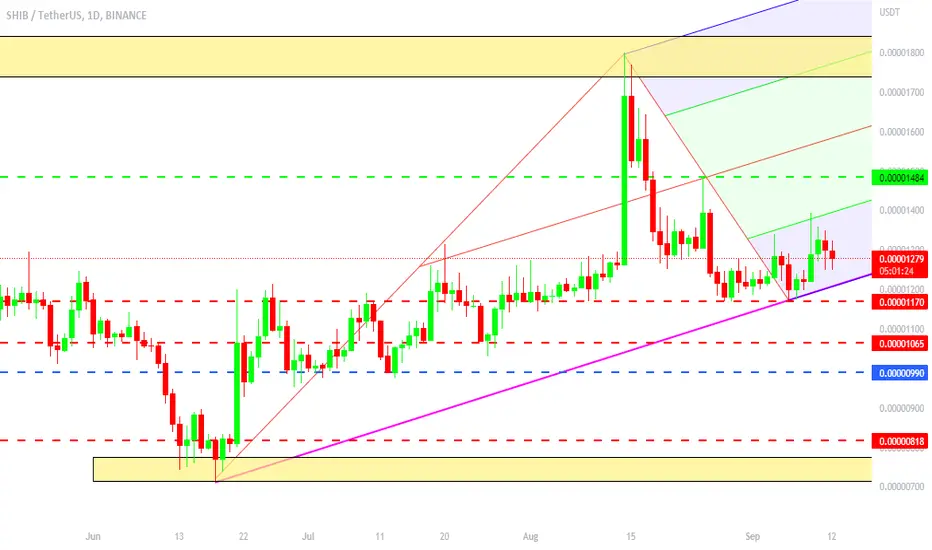
SHIB $ Alertwe have only one support to hold to have a reversal and enter again the bullish momentum , which is the 0.00001170$+, if we held it we going to test again our resistant at 0.00001380$, and going to the test the squeeze level at 0.000017$.
if we didn't hold the current support , we going to see a dip till the 0.00000911$.

shib usdt next move 0.00001065 bye shib inushib inu short 0.00001280 because btc start down trend, cpi repot bad all information deep web
ShibThe Sheba is in an important resistance, you need to break the range down to drop to the bottom 0.000057

SHIB Ready to have a move upAfter a strong bullish move and a deep pullback looks like time for at least a minor trend reversal with high2 and lower low trend reversal buy setup, expecting a move up!
NFA

SHIB broke out trend line ready to fly#SHIB/USDT
$SHIB broke out from descending trend line and confirmed it as support.
🐮 holding above this support can increase price at least 20% to touch next descending trend line.
