SHOP Bull theoryWe can potentially see an earnings run up for SHOP to complet the 5 waves up.
SHOP currently breaking out of the pennant.
MACD about to pick a side, will cross to bearish or bounce back to bullish.
RSI, we can see a support on the RSI, would like to see if it holds.
SHOP

ROKUIf tech pulls back tomorrow, ROKU puts can work under 433 for a move down into 420.
Trade Idea: 7/9 420p under 433. BID/ASK: 5.20/5.50

Fairy DustTo keep it simple, fair value or intrinsic value for a stock can be measured by calculating earnings with a reasonable long term growth rate.
Some tech stocks are currently enjoying extraordinary growth rates averaging around 40%. Some are even higher.
Tesla has an earnings growth rate for the current year of 99.6% and the PE ratio is 684.15 at the current price.
Fair value for the stock price on earth is currently $42.02 (or 136 DOGE)
Let's take a look at these popular names using the formula below:
Fair Value formula:
EPS = earnings per share
8.5 = time in years
G = long term growth rate
FV = EPS X (8.5 + 2G)
Then you adjust for corporate bond yields, the alternative, "safe" investment
Currently we could say they at around 4% yield
Final Value = FV * (4.4 / 0.04)
Below is a list of popular stocks with the current Fair Value assuming they can keep a long term earnings growth rate of 15% annually , which is still an impressive number compared to most companies. Long term it is virtually guaranteed that earnings will decline from current levels so it will be interesting to see this play out in the stock price.
In addition, included below is a chart of where fair value is and text of the current growth rate this year and the P/E ratio.
Data pulled from Yahoo Finance and TD Ameritrade API
Apple
Growth rate: 57.6%
PE ratio: 31.40
Adobe
Growth rate: 21.4%
PE ratio: 51.26
Amazon
Growth rate: 33.5%
PE ratio: 66.81
Facebook
Growth rate: 30%
PE ratio: 30.38
Google
Growth rate: 49%
PE ratio: 31.68
Microsoft
Growth rate: 34.9%
PE ratio: 37.78
Shopify
Growth rate: 11.8%
PE ratio: 114.8
Square
Growth rate: 78.6%
PE ratio: 395.75
Zoom
Growth rate: 40.1%
PE ratio: 134.18
The Trade Desk
Growth rate: -10.10%
PE ratio: 157.6
Nvidia
Growth rate: 58.3%
PE ratio: 97.12
PayPal
Growth rate: 21.9%
PE ratio: 66.13
Using this method the only growth stocks that have realistic upside are Apple, Facebook, Google and Microsoft.

ARKK - Projection PathSee attached projected weekly path for ARKK
Top 5 Holdings include:
TSLA - 10.25%
TDOC - 6.09%
ROKU - 5.71%
SQ - 4.65%
SHOP - 4.23%


US Stock In Play: $SHOP (Shopify Inc)Upon the announcement of expanded partnership with Facebook ($FB) and Google ($GOOGL) for its one-click checkout to be made available to all merchants selling on Facebook and Google even if they do not use $SHOP, $SHOP broke out of its Cup and Handle chart pattern with a significant rally of +14.62%, triggering along with surge in transactional volume exceeding 100% of its 50D average.
With $SHOP making consecutive attempts to print a new all time high closing this week, a price action close above its mid-term trend channel is likely to impose a parabolical price surge in $SHOP in the next 2 weeks. 52 weeks high for $SHOP is at $1552.23.
$SHOP a commerce company, provides a commerce platform and services in Canada, the United States, the United Kingdom, Australia, Latin America, and internationally. The company’s platform provides merchants to run their business in various sales channels, including web and mobile storefronts, physical retail locations, pop-up shops, social media storefronts, native mobile apps, buy buttons, and marketplaces; and enables to manage products and inventory, process orders and payments, fulfill and ship orders


SHOP 4H Short-term/Day trading LONG/BULLISHSHOP 4H Short-term/Day trading LONG/BULLISH - We have seen an amazing uptrend, we took support at the 0.382 of the Fibonacci Retracement ($1183.04) after the first go up and we managed to hit the 0.618 ($1341.27) and the 1.0 ($1438.25) now we expect a Retracement to one of the two main confluences that are pointed out and we will update our targets

SHOP to $1500?SHOPify $SHOP has been basing sideways for awhile now, and has attempted to break and hold above the $1300 range but failed 4 times. Will the 5th time be the charm?
The RSI has broken above so its looking good so far.
Do your own research, this is not financial advice.

$JD Shop made in china online and retail try the climbMarketmiracle advisor today gave an input signal for a LONG position in the title $JD
The company is basically an online and retail big store widely spread and known throughout China.
Through its online store it is also trying to target abroad by providing the portal in various languages.
I checked on some of my reference sites the situation and position of analysts according to which the company currently has a discounted price compared to the fair price.
Considering this I wanted then deepen the graph in search of a possible confirmation for the signal realizing that the title has suffered a powerful retracement from its recent historical highs and that now, in front of excellent macro data has quickly bent towards the ascent.
According to the combination of the two analyses above I expect a confirmation of the signal of Marketmiracle but you know, in the market the devil can always put his finger on it.
This idea is based on the signal generated by the Marketmiracle advisor whose link you can find by scrolling at the bottom of this page.


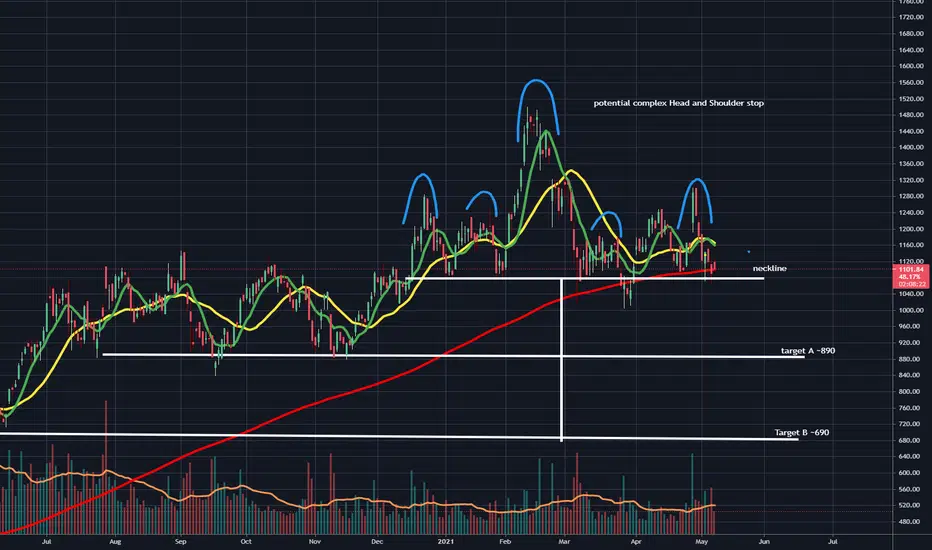
SHOP could head to $690Do your own research, this is not financial advice.
I see a potential "Complex head and shoulders" top pattern forming in SHOPify. If it breaks the neckline it will confirm. Potential targets are outlined where a bounce has a high chance.

SHOPIFY ($SHOP) Technical Analysis Huge potential buy zones at the end of an ABC correction. Very easy buy zones at 884, 808, and 744.


SHOP:Head & Shoulders (with a bearish flag on the shorter term)Id initiate a short/bearish position if it breaks that support (black) come next week, the stocks trading at an ATH, Zacks says it has an insane trailing-twelve-months P/E of 277.63X, comapred to the industry's 30x. The head and shoulders is a red flag, and a bearish flag can be drawn easily, with the line to the right shoulder from the head being the flagpole. A death cross just occured too (the 25 day MA slid under the 100 day MA). While I dont usually use MACD, it slid under the signal line too. So many bearish flags..
Tell me what you think, like to spread the message, itd mean a lot :)
AMA and Ill def respond

SHOP Pre-Earnings SelloffSimilar action has been seen in shop since July with selling before earnings which presumptively can be accredited to profit taking. The only exception would be February where there was a huge run up in price before the report, a flop in earnings created a large selloff. With board members stepping down, there is some uncertainty around SHOP and the looming earnings report makes for a lot more suspense. Current price action would suggest that under 1076 is discount pricing, though that is subject to change if there is sub par reporting next Friday. Month over month shows only a 1% increase in shares short (now 1,800,000) making up only 1.6% of the shares outstanding. To add to that, a P/C ratio of .57 would suggest that the outlook is more bullish.


SHOP S&R Strong Bid Off Swing LowShop dropped all the way to 1006.21 when the market plunged in March. Since correcting 32% from its all time high, SHOP has been strong as the tech led rally continues. Its earnings are coming up this month and it has showed strength throughout April. It is also trading right above its January range which should serve as a strong support.


SHOPIFY potential dip buy (37%)After several days of consolidation SHOP printed a bullish reversal candle
Potential reversal to reach previous all time high with 37% uptrend
Stop loss below lower wick candle
Good luck and thanks for your likes
