SHOP to test 1108 soonShopify is flying after breaking through it's symmetrical triangle the other day and also because of the 21% increase in online sales(highest ever) on Black Friday. SHOP looks to have resistance at 1058 and 1108 but with this momentum looks to break through 1058 soon. With this time of consolidation this may be the breakout moment much higher......
SHOP

SHOP 1D BULLISH FLAG LONG TRADEBull Flags are a Range type pattern.
Bull Flag Ranges are repeatable trading chart patterns.
Descending Bull Flag chart patterns will have a directional bias (Long Trade) depending on the previous incoming trend.
Each chart pattern will have defining trendlines of the support/resistance levels creating the pattern.
What ever time frame you are trading this chart pattern, wait for a candle close outside of the trendline in the direction of the breakout candle. (Our time frame preference is the Daily chart).
Add volume indicator - Volume is the amount of $ that went into a particular candle or in Forex the # of trades that took place.
Add ATR indicator - Volatility is the amount of price movement that occurred. Use the ATR to measure the price movement.
When you see descending Volume bars and descending ATR line (which indicates volatility) this shows
a dis-interest in traders to invest in this pair creating consolidation which creates the chart pattern.
Trade Management after there is a breakout candle close.
1 - Position size (compare volume bar to volume ma line).
a - Breakout candle must be 100% of volume average for a full position size.
b - If 75% of volume average then ½ position size. (To find 75% of Volume
look at the charts volume settings – divide smaller # into larger # = 75%+)
If not 75% then stand aside from the trade.
2 – If candle breaks out of a trendline, 15m before the close of the day prepare your buy/sell order.
Enter two trades. 1st trade will have a SL & TP. It will close automatically when the 1st TP is hit. 2nd
trade only has a SL and will be allowed to run. When 1st TP is hit move the SL to breakeven. Look
at ATR and prepare SL at 1.5 of ATR. Prepare 1st trade TP at 1 of ATR.
3 - SL for both trades will be 1.5 x ATR.
4 - 1st trade TP will be 1 x ATR.
5 - No TP on 2nd trade – letting profit run and adjusting SL to follow price.
6 - When 1st TP hit – move 2nd trade SL to breakeven.
7 - Adjust the 2nd trade SL to follow price.
*8 – After Breakout candle – if price closes back into chart pattern close trade don't wait for SL to be hit.
*9 - When breakout candle is more than 1 ATR from breakout candle open.
a - Enter 1st trade at candle close with ½ position size.
b - Enter 2nd trade with a pending limit order that is 1 ATR of breakout candle open.
c – Price should pullback to that pending limit order for 2nd trade.
d – If Price returns back into chart pattern close trade before SL is hit.

Trendspotter Swing on the Daily, WOWHi Guys,
Just a few alerts set for TS in the daily. See the results for yourself.
Enjoy,
Enda


Shopify Short SetupNice H&S here on SHOP. Watching for a break below the neckline in yellow... Could see a pretty good retracement given the huge run-up SHOP has had this year with relatively little volatility.


Approaching 838 Support and H&SShopify approaching supporting area ~838-839 and making Head and Should pattern. It should hold that neckline area.

SHOP inside daily candleset your alerts from todays high and low on SHOP for tomorrow. if it breaks either with volume, i'll be throwing down til it hits my target to whichever side it broke.

FB/SHOP Sympathy playPartner for e-commerce looks ready to break downtrend with some positive news. Took a while to digest the move from 78 to 162 on the announcement.


SHOP TSX : Technical Analysis - 21 Oct 2020Based on daily time frame : Shop is currently in its down trend seeking its support levels S1 : 1270 and S2 : 1200. RSI is also depicting a downtrend. Anticipated buying range could be in the range of 1270 - 1290. If it breaks S1 at 1270 next buying area will be around 1180 -1200. Since earning date is near on 29 Oct, it is likely that the share price may go up after touching S1 level. Based on the historical trends shop's share price tend to go up a day before its earning date and is very short lived. Take your decisions accordingly for a short term gain.


SHOP Shopify breakout ? LongSHOP looks like it could be ready for another leg up. Smaller ascending triangle up around closing 1072... and potential downtrend break after hours. Watch the 1073 breakout area and up to 1100 as overhead resistance--1040's closest support. If rejected-- that's a play in itself but am hoping to see a breakout on this one.


SHOP looks broken! Target 200 day MA ~~ 700?SHOP has been acting very poorly over the past couple weeks and broke down further today. Failure to hold this level ~~ 880 open the door all the way down to the 200 day MA around 700.

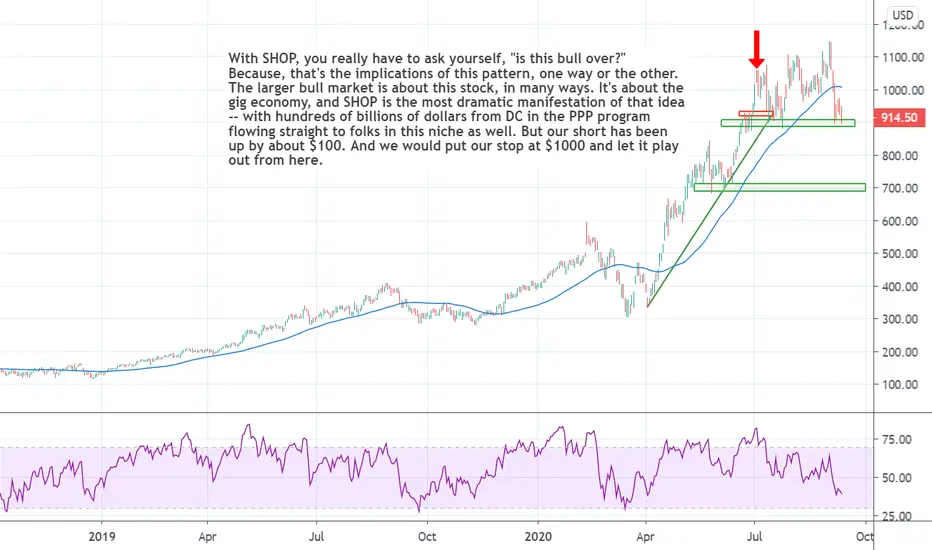
$SHOP Tests Key Range Support as Thematic Engine Faces Key TestSHOP is one where you really have to ask yourself, "is this bull over?" Because, that's the implications of this pattern, one way or the other.
The larger bull market is about this stock, in many ways. It's about the gig economy, and SHOP is the most dramatic manifestation of that idea -- with hundreds of billions of dollars from DC in the PPP program flowing straight to folks in this niche as well.
But our short has been up by about $100. And we would put our stop at $1000 and let it play out from here.
Shopify: hourly reversal Hello traders,
Looking at the hourly chart for shop, we are starting to see hourly reversal as indicated by RSI and MACD bullish divergence.
I am expecting shop to test hourly 50MA in next few trading sessions. Bitcoin is starting to move upward and most likely tech sector will follow as DXY goes down.
Happy trading!


