BUY 960C SHOP DEC 4 With festival season coming SHOP looks a buy at this dip..... Can try 960C DEC 4 STOP LOSS AT 880
Shopify
Approaching 838 Support and H&SShopify approaching supporting area ~838-839 and making Head and Should pattern. It should hold that neckline area.
SHOP: SHOPIFY...UPSIDE POTENTIALWATCH price ACTION carefully ...
ALT: RED-TRACK...25% Chance DIP down before going UP
BIGC looking like itll have another $30 rally soonLooking at the Day Chart you can see that its pretty clear that BIGC might retouch the $70 level
Once it does that i do think that well bounce off that AS LONG AS THE MACD TURNS DIRECTION
You can also see that the last time we had the Mom indicator at these levels it was the start of the bull reversal that took us straight to $108
The Accelerator Oscillator indicator is also showing signs of bullish movements which in turn is showing the bear trend weakening
A solid buy would be right now or waiting a couple day to see if BIGC goes down to the $70 level
If MACD switches sides we are looking at another rally to $108 as well as other tech following
So far i have noticed that BIGC is a leading indicator of other Tech
Earnings will also be a good indication of the direction
FB/SHOP Sympathy playPartner for e-commerce looks ready to break downtrend with some positive news. Took a while to digest the move from 78 to 162 on the announcement.
SHOP TSX : Technical Analysis - 21 Oct 2020Based on daily time frame : Shop is currently in its down trend seeking its support levels S1 : 1270 and S2 : 1200. RSI is also depicting a downtrend. Anticipated buying range could be in the range of 1270 - 1290. If it breaks S1 at 1270 next buying area will be around 1180 -1200. Since earning date is near on 29 Oct, it is likely that the share price may go up after touching S1 level. Based on the historical trends shop's share price tend to go up a day before its earning date and is very short lived. Take your decisions accordingly for a short term gain.
SHOP Shopify breakout ? LongSHOP looks like it could be ready for another leg up. Smaller ascending triangle up around closing 1072... and potential downtrend break after hours. Watch the 1073 breakout area and up to 1100 as overhead resistance--1040's closest support. If rejected-- that's a play in itself but am hoping to see a breakout on this one.
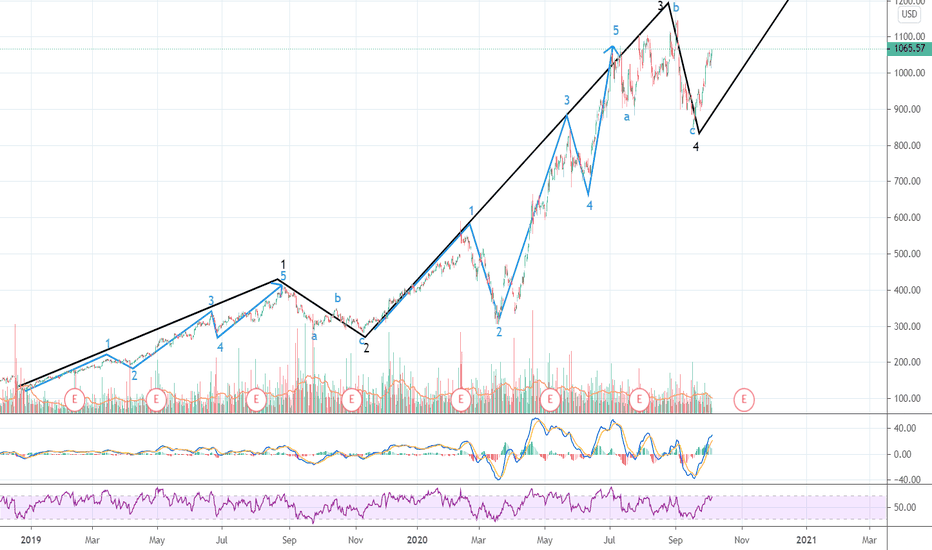
Entering Wave 5 for SHOP -Possible huge run to new highsTony's Picks
I have recently started analyzing charts and have come across this interesting idea.
It looks like $SHOP is about to enter wave 5 via the black line on the daily chart. The blue line trend inside the black waves supports trendy behavior through the Elliot wave theory. The counter trend from the blue line may be over or ending soon. Then wave 5 will begin.
With eCommerce surging and $SHOP at the forefront, strong growth and solid holiday numbers could propel $SHOP to new heights.
Curious to thoughts and comments.
Thank you.
SHOPIFY - UP COMING MOVE - BUYSHOP - Trading on a positive breakout, I am expecting an up move from current price 903
Maintain stop loss around 870
potential upside 938 - 955
Follow the levels as mentioned , Refer the chart for detailed analysis.
Hit the like button & Write in the comment section, Thanks !!
SHOPIFY : Swing, 100% Price ActionSHOPIFY : Follow the uptrend. Look at my other analyzes, great profit :)
Feel free to like❤, comment📝, share👫 and follow me for other analyzes🌍
I predict with the best probability the future trends, my ideas are reserved for the experienced trader. #UniversTrader
SHOP looks broken! Target 200 day MA ~~ 700?SHOP has been acting very poorly over the past couple weeks and broke down further today. Failure to hold this level ~~ 880 open the door all the way down to the 200 day MA around 700.
Shopify: hourly reversal Hello traders,
Looking at the hourly chart for shop, we are starting to see hourly reversal as indicated by RSI and MACD bullish divergence.
I am expecting shop to test hourly 50MA in next few trading sessions. Bitcoin is starting to move upward and most likely tech sector will follow as DXY goes down.
Happy trading!
Why I bought Shopify today.After a three day drop along with increased volume during that time, I decided it was the right time to by NYSE:SHOP . See chart .
SHOP: Trying to Make A Squezee to $950NYSE:SHOP is going LONG. Probably trying to squeeze to $950 before making a small correction.
What do you think?
AFTER LOCKDOWN IMPULSE SHOPIFY IS RANGING - SHOPIFY - DAILYThe price has clearly moved up from February this year. There is a strong correlation between the pandemic global issue and the increase in price.
2020 has been a game changer and we have noticed that the market went up before finding a strong resistance illustrated by the horizontal red line.
Market price is still evolving along the main blue trending line, but might need to push down to the lower level of the new horizontal range created before testing again to break the red resistance.
Overall there a strong probability to see the market price break the red support line, any point close to the bottom support line of the new range is probably a good long entry point.
$SHOP Shopify - Buy the Dip$SHOP Shopify - Buy the Dip
Down almost 4% today on a low volume Friday. Perfect opportunity to buy the dip. The e-com trend isn't going anywhere.
Target: $1,300 by early Sept


