BTC explained in a simple wayVery easy to understand.
We had a correction that will be lower than the others. It lacks one leg down and then up again to mid 9'ties.
Look at the Long/shorts ratio (in the top) and you will see longs are to high and need some squeeze to be healthy again.
Short-btc

BTC / USD Wyckoff DistributionIt doesn't get any clearer than this.
I will link information relating to Wyckoff
stockcharts.com

BTC: Bear Flag, 200EMA and RSI says DOWN!Been a while since the last update, I've been quite busy although I kept reading stuff here and there.
BTC is developing a bear flag BELOW the 200 days EMA. This mainly means we are going down!
Stochastic RSI shows a fast invesrion from the overbought area down to zero.
Personally I would set a target price around 7200, close to the strong trailing support level highlighted in "pink".
As a side note we always need to take into consideration that this market is highly manipulated and almost anything can happen. I'm waiting for a breakout towards the bottom of the bear flag as a trend confirmation.
***As usual, this is not a trading advice.. It is merely my idea for educational and informational purposes only***


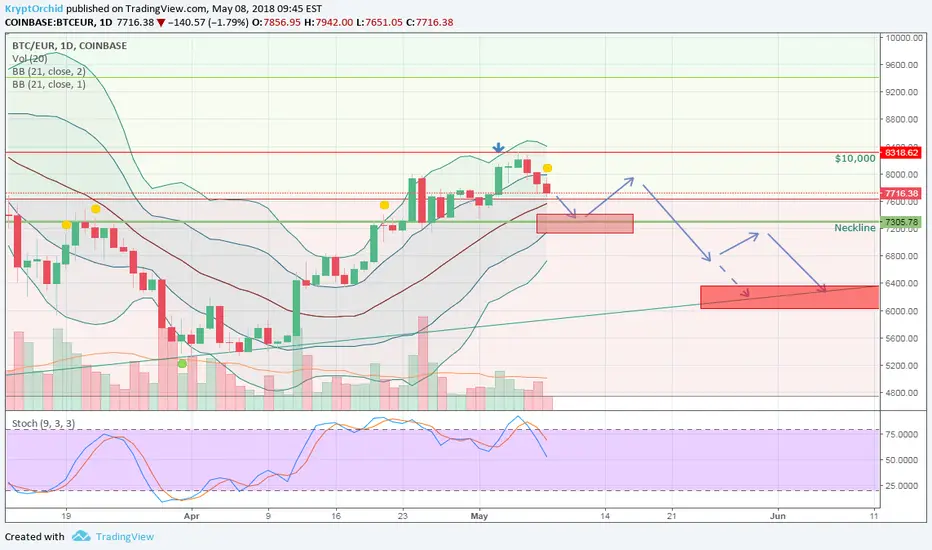
Likely further downward correction at neckline...We're currently testing the 23.6% Fib support level, which if broken can cause the price to fall to the neckline. The second shoulder shouldn't top the first one. A further correction downward could face two possibilities, a rebound around the 2 stdev Bollinger band followed by a retracement once the 1 stdev Bol Band is hit, or straight to the lower trend line.
Dont be a fool. BTC USDPeople say market cap wont go below this and that, because institution money is here now. Whatever.


Too many gains last 2 weeks. Pullback any time nowbefore we go up further....its healhty to test the lows again.

First Real Elliot Wave AnalysisIf my H&S formation plays out, COINBASE:BTCUSD may be at the top of a wave failure denoted by X and heading down to Z @ around $7600.
$7600 should hold, unless FUD takes over, in which case we may see the high to mid $6000 range again (one last time). 04/20 should be close to the last day of the bear market.
15 min RSI and MACD looking to downtrend ASAP.
(No I don't know Elliot Wave theory in the slightest, right now I'm just painting a picture that seems reasonable to me and matching as close as I can.)
Short: Bear
Mid: Neutral
Long: Bull


Bitcoin 3 hr thoughtsThe TD 9 only corrected on itself on the 4hr chart (9 candle went down) and I've noticed the 4hr TD count hasn't been very significant/helpful recently. I have found the 3 hour chart to be more helpful over the last few weeks when it comes to the TD sequential indicator so I want to share my thoughts here.
We have been working on this symmetrical triangle and the price could go either way in my opinion. I do have a target of $1500 to either side though with a possible rebound at 5k-5100 to the downside and an upside target of $8600.
At the very least I expect a 1-4 candle pull back soon when a 9 shows up in 2 candles time (3 to 12hrs downside). If Bitcoin shows strength and rallies up to 7150/7200 with no significant pull back, I will jump back in on the long trade with a stop loss around 6800.
Reasons for long : I honestly don't have a lot for the short term and you'll see why in my 'reasons for short'.
* The 50 week moving average seems to be holding up the price well
*Bitcoin is getting close to being unprofitable to mine and I would speculate that some of the huge companies now involved would try to pump up the price if it became unprofitable. Bitmain declared more profit than Nvidia last financial year so I'm fairly confident there is enough money out there to keep it profitable to mine and I will start buying like a mad man around 5k.
Reasons for short:
*We have been trading under the 200day ma for an extended period. The last time this happened we had a 15 month bear market.
* We had a death cross recently (50 day dipped below the 200 day ma)
* We have had too many opportunities to buy within 10% of the swing low (6500-6600 range) and Bitcoin usually doesn't give you this much time to buy that close to the bottom.
* I have seen some massive shorts over the last week in the order books which makes me suspicious that the Mt Gox trustee is back to selling (up to 5k bitcoin at a time).
* At 5k Bitcoin is still up %500 in a 12month period so it is more possible than people realize.
* If the 50 week moving average is broken, the last time this happened there was a about 12 months of trading below it... Not a good sign..
I'm short right now but long term I'm still bullish for BTC so I'm ready to move with the market and change my position as needed.

Ascending wedge in BTC, possible bearish scenario before takeoffBonjour à tous,
Ascending wedge pattern spotted in Bitcoin!
Here I drew two possible bearish scenarios, as I am not convinced that BTC will pick up momentum from this level, yet.
Scenario 1 - the yellow line - can take us when breaking out of the wedge to the 6000 USD level, where there was previous support. Possibly, prices could go up from here. Should prices consolidate here, an even lower low can be found.
Scenario 2 - the green line - if we were to break the 6000 level, we could proceed to the bearish flag pole target around 4800 - 5000 USD. Around the 5000 is a previous resistance found from late August 2017. This level is also roughly our .786 Fibonacci retracement from the ATH. Should we manage to reach that level, I expect high volume buying orders from the big stacks of money awaiting to get BTC for cheap! Cha-ching
Me, I'm such an amateur trader, so don't take this as trading advice whatsoever!
Good luck!
Maurits

Ethereum Classic in a state of complex correction
it all depends on the behavior of bitcoin. Formed if another link or start pulse...

Best Buy SHORT!Best Buy SHORT!
I believe we will be in for a short on this stock.
I'm anticipating prices to reach highs of 72.00/74.00 with a sharp decline down to lows of 60.00 .
Next earning's 23/05/2018, estimated 0.73 .
Let's wait and see!
TP: 66.00/60.00

BTC to 7.2k Before ReversalJust about to complete ABC corrective pattern of wave 4 - 8400-850 target for completion.
Fifth leg of C wave will find its way to horizontal on trend line support at 7.2-7.3k.
This type of correction must precede any real and natural future uptrend.
Goodluck x

BEARS ARE BACK IN TOWN- Price broke through and closed under the one year channel/trendine
- Very bearish signal
- Price is moving towards support/neckline of a head and shoulder pattern
- Price is likely to bounce off this level
- If price breaks and closes under this level >>> Head and shoulder pattern confirmed >>> Next key support $3000,-

BTC looking like the streets of Sydney sans Mardi GraGood Morning,
My last analysis of Bitcoin still stands and while the Mt Gox coins are still being sold off and the FUD of it lingers we have a real chance of dropping to this previously unimaginable levels. Every time we have a sell of we retrace into either another bearflag or rising wedge and breakdown, the big the flag/wedge the further we drop. Trading ideas with this one would be short term longs while wedges build but caution must be advised but until these Mt Gox coins are sold , I guess the real game here is Shorts. I would stay far away from alts completely, as they will just keep crashing and panic selling will occur. If you dont short, then and fiat is not your play, then best idea would be USDTether or you could short on bitmex 1x which equates to tether without actually holding any.
Take a look at the linked charts to see how things have progressed and how and why I called it.
Good luck and be careful, happy hunting.
G'day Mate,
Thanks for dropping by, hopefully you garner something valuable from my post, be it educational or an idea towards a trade of your own. Please share, like and comment and engage with me, I am here to help. Join me on Bitmex, 10% off fees for 6 months. Feel free to message me on Tradeview , Twitter on even in the Bitmex Troll box and I will be happy to help. With a little guiding and a quality trade plan, Bitmex is the best place to grow your Bitcoin but please do note that Trading leverage just as it is with CFDs or shares has an increased risk, unlike trading on exchanges like Binance or Coinbase, in which if you make a bad trade, with time you can usually break even.

BTC - Forced Volume Incoming?Volume is starting to ramp up again.... Might not get the 9k5 target in the end.. :/

BTC ShortEnding wave 5 soon and even if it is superextended it's unlikely to breach the 11.6 k range prior to some retracemnent/correction.
Some potential entry points are given based on Elliot and Fibonacci retracement and conservative target points are based mostly on Elliot wave and support levels.
This is for educational purposes only and is no way to be used as trading or financial advice.

still favour the short side on bitcoin studing pa min by mintrying to get a very low risk entry here 1min will be my entry

