Short-btc

1RO LONG/ 2DO SHORTsecond shoulder consolidating which give us a litle pump and then a big dip
based on fibonacci, waves, and resistance/support

BITCOIN INTRADAY-TRADE - SHORT BTC Hello Traders,
Bitcoin reached price action point where we are going to watch price closely.
Seems like a short term bearish market after we had a correction and reached demand zone.
Price action should break below again after hunting SL's
We will watch price closely and grab our indicators to get an potential entry.
Have a good week!

BTC Bull Trap #2For an instant replay, see the related idea about the first bull trap.
The Dual BARR top (see other related ideas) speaks to the tendency for BTC to produce a second spike following a breach of strong support/resistance. This second trap setup follows the same logic and works almost like a bearish confirmation in this case, rather than a sign of the new bull trend.
Thus, just gonna wait until BTC hits the green text box before considering a long entry. It is well worth the extremely low probability of a new uptrend starting without hitting this area.
-Dos TrapPigs
BITBAY:BTCUSDT
BITBAY:BTCUSD
COINBASE:BTCUSD
CRYPTOCAP:TOTAL2
COINBASE:ETHUSD
BITFINEX:ADAUSD
BITFINEX:DOGEUSD

FTM/USDT: immediate short oportunity and not only... #staytunnedFantom price today is $0,172048 USD, -12,44% in the last 24h, with a 24-hour trading volume of $20.414.531 USD. On the 4h chart we can see how the assets is currently in a bearish trend, with the trend line identifying lower lows (black line) and lower highs (yellow line), and a MACD below the trendline. The volatility is decreasing, as shown by the Keltner channel, underlying we are in the distribution phase of the market.
A descending triangle pattern has been spotted, with the breakout just happened at $ 0.18323 (still no vol. confirmation), therefore we can expect the price to fall to the next support level, this being $ 0.12 -0.1558 area. RSI index is currently at 28, indicating the asset is strongly overbought, therefore a quick price rise is expected: retest. For this reason I expect the price to retest the broken level of $ 0.18323, before continuing with the downtrend up to $ 0.12 -0.15 area. This can be a good occasion for daily traders ( +18%) for shorting .
TRADE POSITION: short
ENTRY PRICE: $ 0.18688
TARGET I: $ 0.1558 (if the downtrend continues then)
TARGET II: $ 0.144
TARGET III: $ 0.131
STOPLOSS: $ 0.20
Personally, I expect the asset to reach the first short target and later I believe a reversal bullish trend will occur . The coin has very strong fundamentals, is almost overbought also on daily chart, it’s currently very under evaluated compared to the ATH, therefore I expect its price to rise significantly in the long trend, up to 10x potential. For this reason I would personally short up to the first target and later enter a long position at the same price.
On the 4h chart we can see how in the last days the price has continuously hit the lower band of the Keltner channels with the EMA acting as a resistance, but not the upper ones.
Today’s price broke the lower Keltner level and this can be an important signal for the bullish reversal: historically in fact, every time the lower level of the channel was broken, an immediate pullback to the EMA occurred, as pointed in the graph by the arrows. The fact that the volatility is decreasing and the channel is becoming thinner and thinner may imply that the price reversal won’t be so quick. In order to have an idea of when the reversal could occur I use Fibonacci time zones. This acted pretty accurately in predicting historical areas where a swing high, low, or reversal occurred, therefore the 55 vertical line may indicate the end of the bearish pattern, which is believed to be in mid August.
TRADE POSITION: LONG
ENTRY PRICE: $ 0.15
TARGET I: $ 0.18688
TARGET II: $ 0.201
TARGET III: $ 0.238
STOPLOSS: $ 0.13

Bitcoin going down! 8k - 12k bottom Another one! Here we have the head and shoulders formed right after the Musk sell zone. The trend is your friend so follow it. I'm shorting down to target #1. Then Ill accumulate at the Bezzos buy zone!. I called this on another idea but it was stated as soon as the Wykoff distribution showed the BC (Buyers Climax) Phase. The time is now. Good luck everyone. Please like and comment. This is my analysis and idea. Do your research and due diligence before investing, trading, and leverage trading. This is not financial advice.

Inverse relationship between Shorts and BTC FORECASST BIG DUMP!There might be a relationship between the shorts and the BTC price, as we have been holding support in the 30k the volatility is going down this usually signals a big movement either to the downside or the upside.

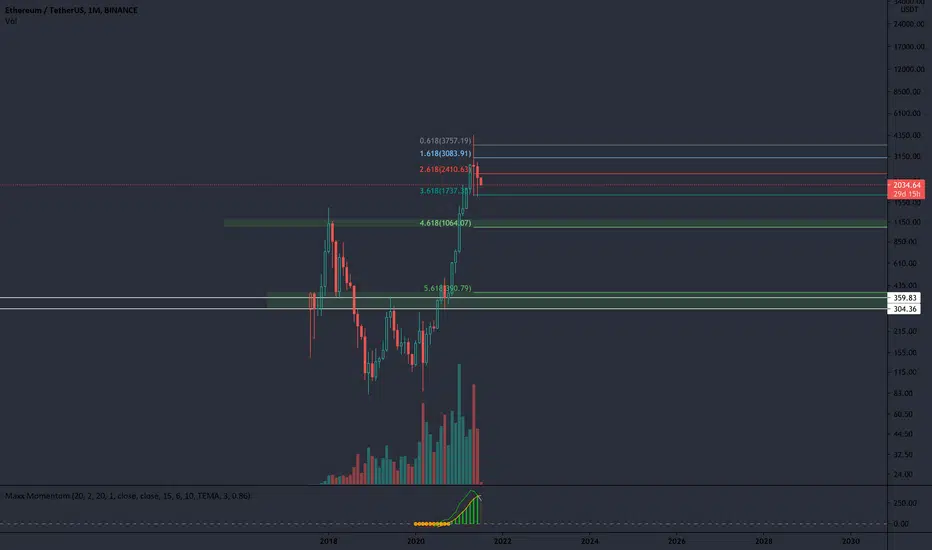
ETH SHORT TARGETS ETH SHORT TARGETS. I EXPECT A SMALL BOUNCE ON THE FIRST TARGET AREA. THIS WILL LIKELY GIVE US A RE TEST FROM 4.618 TO 2.618. IF WE CONTINUE TO REJECT THE 2.618 THEN I EXPECT MUCH LOWER THAN THE 4.618 INTO THE SECOND ZONE. THIS IS THE ZONE I WILL BE HEDGING FROM MY SHORTS AND BACK INTO LONGS.
btc ... short position ( time ferim 1h We can enter the position from the area (33750 to 33700)
Based on macdi the position of the shorts is the most logical case possible.
(Targets are in the picture)

Are you ready for the biggest dump in the history of crypto?This is just for my own reference. Do whatever you want with it.

Bitcoin Cup Pattern !!!!!!!!!!Looks like we have a reverse cup pattern in this chart. Keep your eyes on the chart to enter the sales deal if the pattern is approved!!!

Let The TREND Come To YOU! (CRYPTO CORRECTION)This is a brief overlook of the cryptocurrency market.
With the parabolic price rise that has taken place since the crash from the pandemic, cryptos all across the board have been in a major impulsive buyers market.
We have seen a nice-sized pullback from the highs of 50-60k on bitcoin.
With cryptocurrency, you are seeing a lot of similar correlation across the market with a nice-sized retracement.
What I am waiting for is for the trend bricks and the trend meters to line up on a weekly chart buy confirmation, as I do prefer to trade the larger timeframes for longer-term investments.
We look at the total market cap, bitcoin, ethereum, litecoin, and dogecoin in this analysis to show you the correlation within the market to help you know when a top is in play.
I try to avoid price speculation and let the trends come to me. Staying patient in the markets and letting the big picture unfold is where you will find your best price entries.
For now the weekly and the 3-day charts are bleeding out, with no signal for me to want to enter the cryptocurrency sector.
I wish the best for you all,
Take Care.

Short scenario for BTCWaiting for divergence and bos on LTF as a confirmation to enter the trade. I will also use LTF to find the best entry point.
I am new to trading so there's a high possibility that my scenario is wrong. Constructive criticism is highly appreciated in the comments)

BTC H S / W PATTERNHey everyone
This is my prediction of BTC chart today. We will see a W pattern in my opinion and a small HS.
I will play a short in the Right shoulder until we bounce of the 30k Support again.

Bitcoin - Just look at the chart, Bullish or Bearish? Dear friends,
I can't resist showing you this chart of Bitcoin.
Why? Because many people are afraid of a decline! Is it right?
Look at this chart and judge yourself. By the way, I respect the opinion of everybody. It is not right or wrong. It is an idea and the number of logic elements make it more or less valid. Feelings about prices tend to be often wrong so that is the reason I like to trade what I see and not what I think.
There is always your stop loss, Stop loss hit, perfect, buy it even lower. But the main trend of Bitoin is up and it will reach much higher prices in the future due to the limited quantity of coins to be mined. (not so with others).
1. This chart shows that Bitcoin is still in a bull market! Although at the bottom of the channel, the bottoms are still rising! A quick look and you see it right away without even thinking.
2 The 200 MA slope is also bullish and pointed upwards! The price is below the MA but price always comes back to the MA. A falling slope of the 200-period MA is very different and indicates a bear market. Not the case here.
If Bitcoin completes the 4 year cycle as it should be (Also read my previous updates on why Bitcoin is interesting with the US printing trillions of dollars) then you get a more complete and clear picture.
The red trajectory is a possible traject but if Bitcoin with a close daily candle below 30000 then that is a clear breakout from the longer term trend channel with possibly 10000 as a goal. But even then Bitcoin remains in a rising trend. This trend line can be seen standing at 15000 by the end of 2021.
This is what the chart shows and what could be possible because it did not happen yet!
Please share your thoughts and idea's below dear friends. What do you think and why do you think it.
I wish you all good luck with trading!
Disclaimer Traders this is my view, no advice to buy or sell. Also always do your own research!
--->> Traders please follow me for updates and give me support with a like 👍 if you like me to continue this work. Thanks 💚


BTC Dropping - Update #3 - Low TimeFrameFor Scalping, and i believe my Darling Bitcoin will see 30,000 to 24,600 Soon, and that will be STRONG step to grow 100,000 :)
W! : This is only my Analyses to show you numbers better, at the last you'll Decide better than others , so Not Financial Advice.

BTC/USD Clearly bear market!This is what a technical analysis means, looking at the past. When we look at the previous end of the bull market it is following the exact same pattern now. Do not let these "hope giving" social media posts get you! Stick to the charts, not to the emotions or opinions of people!


BTC Short areas, High probability trades Golden pocket boxesexpecting BTC to pump atleast to 36.8k or higher, CME Gap 36.900


Next leg down incoming...Clear bearish pennant forming on $BTC -- Called the top on this a few weeks back, next leg down coming soon ladies and gents ;)

Ichimoku Entries With the TrendWhen using the Ichimoku indicator, it is usually a good idea to enter a trade in the direction of the trend when you see the Tenkan & Kijun close together and when the Tenkan, Kijun, and Cloud have sharp angulation pointing to the future price of the asset.
You can see in the chart that this was the case previously as the price rose, now it could be the same case as we move down in the opposite direction.
