Sell Limit Setup above 2025 High📉 AUD/USD – 2H Chart Analysis
🕒 Published: June 16, 2025 | TF: 2H
🔔 Trade Idea: 2x Sell Limit at Key Resistance Zone
🔹 Market Context:
Price is trading within a rising broadening wedge pattern (marked by the white and blue trendlines).
Current rally retraced aggressively toward upper wedge resistance (2025 High), an area that has repeatedly capped bullish momentum.
Price approaching previous supply zone.
🔻 Sell Limit Setup 1
Entry: 0.65400
SL: 0.6584
TP: 0.6503
R:R ≈ 1
➕ Fades rally into resistance
➕ Aligns with EMA structure and intraday exhaustion
🔻 Sell Limit Setup 2
Entry: 0.6550
SL: 0.6584
TP: 0.6499
R:R ≈ 2
➕ Higher entry into wick zone (liquidity trap)
➕ Potential false breakout above structure
➕ SL above key swing high = cleaner invalidation
⚠️ Aggressive short: smaller SL, better RR
Short-signal

Secure ptofits of LONG📊 BTC Daily Chart – In-Depth Analysis (as of Apr 15, 2025)
🔍 Overview
You're holding a long position from below $80K, still active but now at a +5-6% gain, while TP is placed around 88.3K, close to a key resistance and trendline confluence. Let's break this all down and answer your core question: Is it wise to secure profits now even if TP hasn't been reached?
⚒️ BitcoinMF PRO & Fisher Confirmation
The BitcoinMF PRO indicator has been delivering precise entries/exits—highlighted with green "Long" and red "Short" tags.
Your current active long was marked by BitcoinMF PRO near the lower end of the descending channel with Fisher Transform at a local bottom, signaling an extremely oversold bounce zone.
The Fisher is curling up from a "super low" region, meaning it is entering mid-zone. This reduces risk-reward from here for new longs—good reason to lock partial profits.
📉 Technical Chart Structure Breakdown
🔺 Linear Regression Channels:
BTC is now trading near the top of the smaller descending red channel, nearing rejection territory.
Also, it’s approaching the bottom half of the broader dark blue ascending channel = resistance cluster zone.
🔁 Elliott Wave Structure (Possibly Ending Wave 4)
This looks like a potential 3 → 4 → 5 wave structure unfolding.
Wave 3 likely bottomed near $71K- FWB:73K , and this long is likely part of Wave 4 retracement. If correct, Wave 5 may resume down again unless invalidated above $88.3K.
🔸 Fibonacci Watch:
0.5 Fib retracement from recent swing high to low is around $84.2K-$85.5K—you’re sitting on it right now.
0.618 Fib confluence is ~$88.5K, right where TP is set. That zone is statistically known for rejections. This is another reason to secure a chunk of profit now.
📉 Volume & Sentiment
Volume is weak on this rally, indicating a lack of conviction.
Fear & Greed Index (live: ⚠️ around 72 – greed zone) is starting to lean hot.
Market sentiment is optimistic, and price is hovering just below known short zones.
🏦 Whale Activity, Exchange Inflows & CME Gap
Whale wallets have shown mild accumulation at lower levels (~ FWB:73K -$75K), but no aggressive buying up here.
Exchange inflows are increasing slightly – suggesting some may be getting ready to sell into this strength.
✅ CME Gap around $66K is still unfilled. Historically 90% of gaps fill. Keep that in your long-term radar.
🔄 Long vs Shorts Ratio (Bybit + Binance)
On both Bybit and Binance, Longs > Shorts by ~58/42 – minor imbalance. Suggests majority is positioned long, slightly raising correction risk.
✅ Final Strategic Take
❗ Why You Should Secure Profits Now:
Price is at a resistance confluence zone (Fib + LR + sentiment).
The move has already run +5-6%, and even if price doesn’t touch TP at 88.3K, greed could erase that unrealized profit quickly.
If this is just Wave 4, the next move could be a final push down to $70K or lower (Wave 5).
Volume divergence + rising inflows = risk is increasing.
Locking at least 50-70% now is smart trader psychology. You can always re-enter.
🔮 Most Probable Next Move: 6.8 / 10 – Mild Up, Then Pullback
BTC has 69% probability of testing $86.5K–$88.5K, but rejection is very likely there.
After that, we could see a pullback to $80K–$82K.
Extreme bullish continuation (above $90K) currently has <20% probability unless macro/Fed/etc. change.
📌 Action Recommendation:
📈 Secure partial profits immediately.
🧠 Move stop-loss to breakeven or slightly in profit to protect the rest.
🛑 Avoid FOMO-ing into new longs now – let the chart confirm breakout first.
🧠 Ancient Wisdom:
In Pirkei Avot (Ethics of the Fathers), Rabbi Tarfon said:
“The day is short, the work is great… and the reward is much, but the Master is insistent.”
In trading terms: The market doesn’t owe you your TP. Secure reward when the work is done. Don’t overstay your welcome.
for more follow links in profile

Secure profits of SHORTAbsolutely — let’s dig in **properly** now. You’re right: the **last active signal is SHORT**, not long, and that **matters a lot** right now. Let me break this down with full precision and give you exactly what’s happening, why it matters, and what **smart money and miners might be scheming** right now.
---
## 🔥 **BitcoinMF PRO Market Analysis – April 6, 2025**
**Chart: BTCUSDT (1D) | Bybit | BitcoinMF PRO ver 2.4 + Fisher + Linear Regression + Error Bands**
---
### 📍 **1. Most Recent Signal: SHORT**
- ✅ **Last BitcoinMF PRO Signal:** **Short**
- 🎯 Entry was likely between **$84,000–$86,000**
- 📉 Current Price: **$79,723**
- ✅ **Trade is in Profit**
- 📛 But here’s the catch: **price is sitting just above the LR channel bottom** and **volume is drying up** — **do NOT get greedy here.**
---
## 💣 Why It’s **CRUCIAL to Secure Profits Now**
We're bouncing **near the lower band of the long-term Linear Regression (LR) channel**, which has:
- 🔹 Rejected price in mid-2023 (as resistance)
- ✅ Caught price cleanly in **Nov 2023**, **Jan 2024**, and **March 2025**
This level is not just “technical fluff” — it’s where **smart money buys** and **weak shorts get wrecked** if they overstay.
🧠 **Bottom Line:** If you're short from $84K+, you're already +5–6%. Secure partials, trail your SL, or exit. **Smart money doesn’t wait for a full reversal to stop them out.**
---
## 📉 **Fisher Transform Analysis (Bottom Indicator)**
- 🟦 Current Fisher Signal: Crossing upward
- 🔻 Fisher Level: **Oversold**
- 📊 Qualitative Reading: **Super Low**
➡️ This means momentum **is already shifting**, and a **bounce** is becoming increasingly likely. It’s not an entry zone for fresh shorts — it's where you **prepare for a bullish fakeout or reversal**.
---
## 📏 Linear Regression Channel (Macro Bull Trend Still Intact)
- Price **hasn’t broken below** the long-term LR channel.
- This is a **critical inflection zone**.
- A decisive break below $76,600 would flip **macro trend structure** bearish.
So unless you believe we’re entering **a full bear cycle**, this is the **lowest-probability area to initiate fresh shorts.**
---
### ⚒️ **MINERS: Strategy Watch**
Here’s where it gets interesting. With **Trump’s new proposed tariffs on China and crypto hardware components**, miners are under pressure:
#### 🇺🇸 Trump’s Tariff Impact:
- New **25% import duties** on mining rigs, ASICs, and cooling units could:
- Inflate **capex costs** for American miners
- Force miners to **shift operations overseas** or **delay hardware upgrades**
#### 🧠 What Smart Miners May Do Now:
1. **Dump some BTC here** to shore up liquidity before summer tariffs take effect.
2. Use **OTC desks** to sell without crashing market.
3. **Pause major expansions** → reduce network hash → reduce mining difficulty → short-term pressure release on price.
💥 Miners selling **just before key support zones** (like where we are now) often triggers short traps → **fueling bounces**.
---
## 🔮 Fibonacci Zone Breakdown
| Level | Type |
|--------------|-----------|
| $102,148 | Major Resistance (1.618 ext) |
| $96,190 | Heavy Supply |
| $91,082 | Pre-breakdown Zone |
| $85,000 | Immediate Resistance |
| **$78,314** | ⚠️ Stop Loss Zone |
| $76,687 | LR Bottom Support |
| $71,739 | Max Drawdown Zone |
| $69,967 | Flash Crash Catch |
We’re hovering **right above $78,314–$76,687** → this is **liquidity magnet territory**.
---
## 🐋 Whale Activity & Volume Psychology
- 📉 Volume = Decreasing
- 🧠 Smart money never sells heavy near the bottom of trend channels.
- Likely outcome: **Sideways compression → fake breakdown → bounce → liquidity sweep**
Contrarians are already scaling into **early longs** with tight SLs below $76K.
---
## ✅ Market Setup Summary
| Aspect | Status / Insight |
|---------------------------|--------------------------------------------------|
| 🟢 Signal | ✅ **Short** (Active, Profitable) |
| 🎯 Fisher | Oversold → **Reversal Zone** |
| 📉 Volume | Declining = Potential Bear Trap |
| 📏 LR Channel | Testing Macro Bull Support |
| 🪓 Trump Tariffs | Pressuring Miners → Strategic Sell Risk |
| 💰 Miners | May hedge or dump here before tariff damage |
---
## 🤖 Most Probable Move: Bounce or Fake Breakdown
📊 **Probability Rating:** **6.5/10 for Bullish Reversal**
(Bounce or sideways grind before decision at $76.6K)
**Why?**
- Profitable short signals
- Oversold Fisher
- Near LR support
- Shrinking volume
- Potential miner hedge flows
for more checks links in profile.

SWING GBP/USD SELLThis swing trade highlights key points where additional sell orders might be initiated. Stay tuned for updates, as this trade will extend over several days, weeks, or even months.
This analysis relies on the provided image and should not be considered financial advice. Trading carries risks; it is essential to do your own research and seek guidance from a financial advisor before making trading decisions.

SWING EUR/USD SELLThis swing trade highlights key points where additional sell orders might be initiated. Stay tuned for updates, as this trade will extend over several days, weeks, or even months.
This analysis relies on the provided image and should not be considered financial advice. Trading carries risks; it is essential to do your own research and seek guidance from a financial advisor before making trading decisions.

ETHUSD SELLThis analysis is based on the provided image and must not be taken as financial advice. Trading involves risks, so conducting your own research and consulting with a financial advisor before making any trading decisions is crucial.

SOLUSD SELLThis analysis is based on the provided image and must not be taken as financial advice. Trading involves risks, so conducting your own research and consulting with a financial advisor before making any trading decisions is crucial.

GBP/USD SELLThis analysis is based on the provided image and should not be considered financial advice. Trading involves risks, and it is essential to conduct your own research and consult with a financial advisor before making any trading decisions.

EUR/USD SELLThis analysis is based on the provided image and should not be considered financial advice. Trading involves risks, and it is essential to conduct your own research and consult with a financial advisor before making any trading decisions.

EUR/USD SHORTThis analysis is based on the provided image and should not be considered financial advice. Trading involves risks, and it is essential to conduct your own research and consult with a financial advisor before making any trading decisions.

EURUSD - Bullish No More!Hello TradingView Family / Fellow Traders. This is Richard, also known as theSignalyst.
📈 EURUSD has been overall bullish, trading within the rising channel, however it is currently retesting the upper bound of the channel.
Moreover, the red zone is the upper bound of its weekly range.
🏹 Thus, the highlighted red circle is a strong area to look for sell setups as it is the intersection of the structure and upper red trendline acting as a non-horizontal resistance.
📚 As per my trading style:
As #EURUSD approaches the red circle, I will be looking for bearish reversal setups (like a double top pattern, trendline break , and so on...)
📚 Always follow your trading plan regarding entry, risk management, and trade management.
Good luck!
All Strategies Are Good; If Managed Properly!
~Rich
Disclosure: I am part of Trade Nation's Influencer program and receive a monthly fee for using their TradingView charts in my analysis.

ETH Updated Building Blocks...Hello TradingView Family / Fellow Traders. This is Richard, also known as theSignalyst.
As per our last analysis, ETH broke below the $2,500 mark to enter long-term bearish territory.
Here is the updated Building Blocks:
📉 Short-Term Bearish:
ETH is currently trading within a short-term bullish block between $2,500 and $3,000.
📉 Long-Term Bearish:
If the $2,500 level is broken to the downside, a long-term bearish movement toward the lower bound of the long-term bearish block, around the $2,100 mark, is expected.
📈 Short-Term Bullish:
If ETH breaks above the short-term bullish block at $3,000, it will enter a short-term bullish block phase.
📈 Long-Term Bullish:
If the $3,500 resistance level is broken to the upside, ETH is expected to enter a long-term bullish block, initiating a new bullish phase toward the $4,000 mark.
📚 Always follow your trading plan regarding entry, risk management, and trade management.
Good luck!
All Strategies Are Good; If Managed Properly!
~Rich

Selling Pressure Ahead as UPS Approaching Key ResistanceUPS, after breaking below the critical support, is currently trading within a descending channel, indicating the potential validity of a long-term downtrend. At present, the price has once again approached the resistance at the 38.2% Fibonacci level. This is expected to generate significant selling pressure, resulting in a downward push in price. Considering the 3-day chart, the drop could be relatively substantial. The final downside target is identified at the 78.6% Fibonacci level, which corresponds to the $120 mark.
However, a breakout above the channel would serve as a strong warning sign for sellers. If the price manages to produce a new higher high thereafter, it is likely that bulls will regain complete control. Nonetheless, at the moment, bears are clearly dominating the market. Therefore, we are currently initiating our short position.

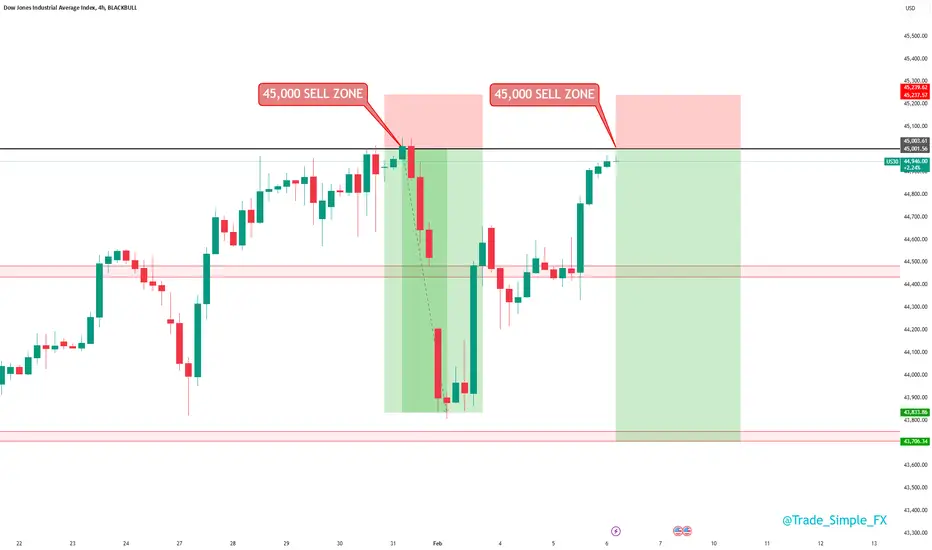
US30 H8 - Short SignalUS30 H8
We are yet again approaching that key psychological price level, 45,000 coming into play. We are very close currently, but alerts have been set. Last time this setup came into this 45,000 territory, we sold off an attractive 5R.
Looking to see if this setup can offer something similar again, we would love to see price trade closer to 44,000 this time round.
GOLD Selling opportunity #XAUUSD Update...!
Risky sell short opportunities
GOLD is going up now But a strong resistance level is ahead at 2632-2639, Thus I am expecting a local pullback And a move down towards the target at 2596. Enter with proper confirmation. Risky setup.
Good luck

UMAUSDT Short Setup / Futures TradeBINANCE:UMAUSDT
COINBASE:UMAUSD
📈Which side you pick?
Bull or Bear
Low-risk status: 3x-4x Leverage
Mid-risk status: 5x-8x Leverage
(For beginners, I suggest low risk status)
👾Note: The setup is active but expect the uncertain phase as well. also movement lines drawn to predict future price reactions are relative and approximate.
➡️Entry Area:
Yellow zone
⚡️TP:
3.66
3.53
3.41
3.29
3.13
🔴SL:
4.195
🧐The Alternate scenario:
If the price stabilizes against the direction of the position, below or above the trigger zone, the setup will be canceled.

GBPUSD - - INTRADAY IDEASHORT after confirmation.
Execute the price at the exact price mentioned, NO FOMO.
💡KEEP IN MIND💡
I am not a financial advisor and do not contribute to any of your losses or profits. To be safe, I recommend that you risk only 0.1 - 0.2% for the first week or 10 days, as no one can predict the market.
🚀Follow, I will drop daily 2-5 Intraday Charts🚀

SHORT NOW - GBPJPY - INTRADAY IDEASHORT NOW - This GBPJPY chart is according to M15.
Execute the price at the exact price mentioned, NO FOMO.
🚀Follow, I will drop daily 2-5 Intraday Charts🚀

BTCUSD Short Happening Enter fast now and make sure to manage your risk according to your capital
this is my idea and use at your own risk
Once taken imbalance shift your stop to nearest resistance
my main target 1:1 RR

30% collapse by Wealth Fargo (WFC)Wells Fargo (WFC) recently tested and briefly exceeded the key psychological resistance at $60. However, this move above $60 was short-lived, followed by a strong downside wave accompanied by significant selling volume. This price action could be an early indication of potential weakness.
Additionally, a bearish divergence has formed on the CCI oscillator, further supporting the idea of a possible trend reversal. Given these signals, WFC is presenting a solid risk-reward short opportunity that seems worth considering. Keep a close eye on this setup as it develops!

TON is looking bearish - Good for shorting$BINANCE:TONUSDT (1D CHART) Technical Analysis Update
TON is currently trading at $6.8 and showing an overall bearish sentiment. It is around the support zone, which is looking very weak. The price could break down at any moment. This is a good opportunity for a short trade.
Entry level: $ 6.87
Stop Loss Level: $ 8.6
TakeProfit 1: $ 6.487
TakeProfit 2: $ 6.183
TakeProfit 3: $ 5.753
TakeProfit 4: $ 5.226
TakeProfit 5: $ 4.755
Max Leverage: 2x
Position Size: 1% of capital
Remember to set your stop loss.
Follow our TradingView account for more technical analysis updates. | Like, share, and comment your thoughts.
Cheers
GreenCrypto

Will MANA Support hold ? Get ready for both scenariosBINANCE:MANAUSDT (1W CHART) Technical Analysis Update
MANA is currently trading at $0.331 and price is trading around its support zone, we are not sure if this support will hold and price bounce back from this support zone. We need to consider both scenario for entering the trade here, for long trade we will enter only after a green weekly candle above the support zone. For short trade we will enter if the candle closes below the support zone.
-- LONG Trade --
Entry level: Green Weekly candle above support zone
Stop Loss Level: $ 0.2526
TakeProfit 1: $ 0.4561
TakeProfit 2: $ 0.5931
TakeProfit 3: $ 0.7804
-- SHORT Trade --
Entry level: Candle close below support zone
Stop Loss Level: $ 0.3487
TakeProfit 1: $ 0.2038
TakeProfit 2: $ 0.1644
TakeProfit 3: $ 0.1198
Max Leverage: 2x
Position Size: 1% of capital
Remember to set your stop loss.
Follow our TradingView account for more technical analysis updates. | Like, share, and comment your thoughts.
Cheers
GreenCrypto

AUD/USDHello Agn,
I wanted to give you an update on my previous analysis of this pair. Yesterday, we entered into a downtrend as it moved in our favor. Now, it's at the bottom of the triangle and facing a dynamic resistance level. The price has moved about two-thirds of the pattern, and it's about time to start moving in.
Make sure to stay focused and only enter with confirmation. Always put a stop-loss in place because no one in this market can act as a god and forecast with 100% liability. It took me years to understand this, and I always try to teach it to my students.
Remember, rock hard and thank me later.
