EURGBP SELLA GOOD LEVEL FOR A EUR REVERSAL HERE WITH GBP LOOKING DUE TO MAKE A PUSH BACK AGANST SOME OF ITS MAJOR COUNTERPARTS. A STRONG SELL AREA. WE HAVE ENTERED THE TRADE SHORT. GOOD LUCK
Short-signal

Gold SELL!The price has rapidly driven up to a key level and trend line. We expect to find resistance around this area and see it as a good area for a short trade to be taken.Good Luck


GBPUSD SHORT - 130 PIPSBased on my analysis and theory, GBPUSD will short this week to Target Area 1.
Confident level: 99%
Trade at your own risk.

BNB/USDT Reversing After Double TopBNB/USDT is falling sharply after painting a double top yesterday. With the overall bearish momentum of the crypto markets, I'm seeing this pair dropping all the way to the $27.50 support. Do your own DD.

EUR/GBP Pull back and push up!Here we can see the Euro chart falling directly in line with the analysis we have provided over the last few weeks. With continued pound weakness surely on the horizon our prediction will be "move A" a pull back and test of the trend line, followed by an upside turn 'move B" pushing the pair higher. Good Luck.

EUR/CHF Rejected Resistance Once AgainFor several months now, EUR/CHF is trying to reach the 1.09 area, without any luck.
Every rejection of the area of strong resistance has led to a fall of more than 50 pips. My bet is that history will repeat itself next week.
I'm eyeing Support 1 and Support 2, but feel free to do your own DD.

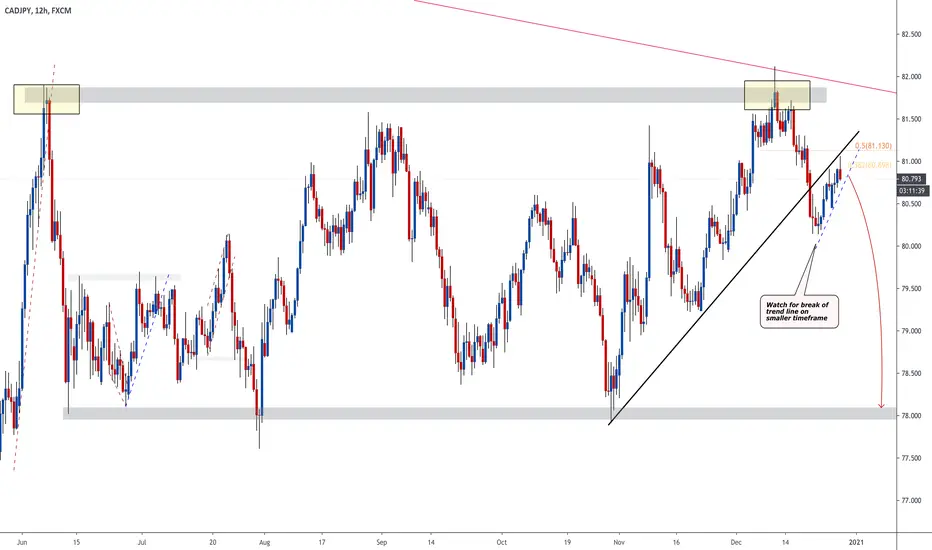
CAD/JPY Short Term ReversalCAD/JPY is following an bullish triangle for a few months now. Sadly, the 82 resistance level got rejected yet again.
Since this pair is following the triangle firmly, this reversal makes me believe we're heading towards the lower trend line again.
Be wary around the green marked area, since it's close to the previous low. Considering exiting a part of your position around that area.

GBP/JPY Falling: Multi Resistance & BrexitGBP/JPY is following the drawn wedge since the early days of 2020, reversing every time it hit either the upper or the lower trend line.
Not only is the wedge holding strong, the 140 area is holding up as well: the price failed to close above 140 for the eighth (!) time now.
Combine the above with the failing Brexit talks, and we have a recipe for disaster on our hands.
Im considering Support 1 and Support 2 as potential exits, but feel free to do your own DD.

GOLD (XAUUSD): Morning Scalping
GOLD just broke below a support of a rising wedge pattern.
Taking into consideration that the price is trading on a key level right now,
I expect a strong bearish reaction.
Goals:
1846
1839
Scalping trades are risky.
Don't risk more than 0.5% of your deposit

GBP/USD SHORT!After Brexit talks get ANOTHER extension the pound rallied on the open last night pushing most of its counterparts back to key levels. In doing so with cable we have created a strong intra day trend here presenting a good SELL opportunity from this area. Expected the pair to move up and down at first and be prepared to hold. We are live in the trade and wait for the downside to fill the gap. Good Luck

PayPal Reversing AgainIn my previous PayPal post I foresaw a $215 price target. What I can clearly see now is that the channel is holding strong and that PayPal is on its way back again towards earlier support levels.
Im eyeballing Support 1 and Support 2 as potential exits, but please do your own DD.


EUR/GBP Inside a WedgeEUR/GBP has been following this wedge for more than half a year. My take is that it will follow it till the end of the year.
Im eyeing the green marked area as a potential area of reversal, but feel free to set your own targets.

AMAZON [AMZN] Short Idea: Bearish TriangleAMAZON is behaving fairly choppy since August. My guess is that it will continue to oscillate for while since we had the massive corona run-up.
Im eyeing Support 1 and Support 2 as short term potential targets. Be careful holding this stock too long, it might see another run up towards Q1'21 earnings.

ETH/USDT Bearish Triangle: Correction PossibleETH/USDT previously formed a beautiful triangle on the 1H chart. Since the highs are consecutively lower, this is a bearish set-up.
I'm waiting until the price closes below $560 on the 4H chart. This could be the catalyst to propel the price towards the support levels on the chart. Do your own DD before entering a trade.

GBP/USD Bounced From Strong Resistance: Brexit UpdateGBP/USD didn't manage to beat the 1.35 resistance for a third time today, signaling a new downward movement in the coming days.
Furthermore, it became apparent that the GB-EU Brexit talks are taking a turn for the worse, potentially even being cancelled altogether. This action would mean that a No-Deal Brexit is imminent and you should trade accordingly.
My guess will be that the EU and GB will fail to find compromises and that no deal will be found, launching GBP and EUR into the abyss.

GBP/AUD Head and Shoulders CompleteIn my most recent GBP/AUD post I made the prediction that there was a bearish Head and Shoulder pattern forming on the 4H chart. Today, the pattern finalized, signaling a new path downwards for the pair.
Also, it became apparent that the GB-EU Brexit talks are taking a turn for the worse, potentially even being cancelled altogether. This action would mean that a No-Deal Brexit is imminent and you should trade accordingly.
My guess will be that the EU and GB will fail to find compromises and that no deal will be found, launching GBP and EUR into the abyss.

GBP/CHF No-Deal Brexit ScenarioEarly December GBP/CHF failed to beat the 1.22 resistance two times, which was already a short signal by itself.
Today it became apparent that the GB-EU Brexit talks are taking a turn for the worse, potentially even being cancelled altogether. This action would mean that a No-Deal Brexit is imminent and you should trade accordingly.
My guess will be that the EU and GB will fail to find compromises and that no deal will be found, launching GBP and EUR into the abyss.

EUR/CHF Bearish - Brexit ScenarioEUR/CHF failed to pierce through the red area of resistance and is on its way back to earlier support levels.
Today it became apparent that the GB-EU Brexit talks are taking a turn for the worse, potentially even being cancelled altogether. This action would mean that a No-Deal Brexit is imminent and you should trade accordingly.
My guess will be that the EU and GB will fail to find compromises and that no deal will be found, launching GBP and EUR into the abyss.

Bitcoin Bearish Triangle FormationOn the 1H chart, a bearish triangle is forming on the BTC/USDT chart. Looking at the fact that Bitcoin has failed to breach the $20k wall two times now, it might be time for a healthy short term correction.
Support 1 would be my best guess where the price could reverse in case of some downward movement in the coming days. If Bitcoin might end up in a free-fall, Support 2 would be a great area to opt-in for a long position.
There's a lot of volatility in the crypto market, do your own DD and trade safe.

