USD/ZAR is breaking out of a critical channelOANDA:USDZAR is breaking out of a critical parallel channel
We have been short the Rand (i.e Long the USD/ZAR pair) since it broke out of the previous parallel channel, however the Rand is gaining strength against the dollar.
We closed the position once the rand hit the 1.618 fib extension target at R18.38/$.
We have switched to a long position on the ZAR due to the following (i.e short position on the USD/ZAR pair):
1) There are multiple bearish divergences that was flashing at the R18.38/$ target
2) We have now closed 5 daily candles below the 50day SMA
3) Rejection at the 1.618 Fib extension target
4) Daily close below the parallel channel that has been in place for a good portion of the 2022
Targets are as follows:
1) R16.8/$ - This is the strongest support and one should close majority of the trade at this target
2) R15.87/$
3) R15.2/$
Good luck
Short-trading

InvestMate|DAX correction on the way🥨DAX correction on the way.
🥨As in my last post I predicted a rise in the DAX idx this time it was time for a correction.
🥨After a month-long rise of equal to 14 from the bottom, can we speak of an imminent correction?
🥨By all means.
🥨The Dax has only made one major correction in its journey to the top, amounting to 78.6% of the first downward wave. After which it started its 3rd wave rally
🥨I believe that in this case a correction is inevitable and will happen sooner or later.
🥨Will it be tomorrow morning at the opening of the German stock market?
🥨Perhaps.
🥨I don't want to imply here that we have already exhausted maximum strength but whether with or without a new peak I expect some kind of significant correction on this index.
🥨In order to determine possible levels to which the price could descend, I have used a fibo wave measurement. First from bottom to top then I measured the biggest correction in the whole upward impulse and measured one to one.
🥨It showed me an interesting cluster of levels at 0.382 and 1:1 which falls in the price range between 12800 and 12731 and if the price would start heading south with the return of the negative sentiment a return to the designated zone becomes highly probable.
🚀If you appreciate my work and effort put into this post I encourage you to leave a like and give a follow on my profile.🚀

InvestMate|USD/JPY waterfall coming up💱USD/JPY waterfall coming up.
💱For some time now, since 21 October to be precise, we have seen a trend reversal on the USD/JPY pair.
💱The reversal was abrupt in nature, it was done through the monetary intervention that Japan made in order to stop weakening its currency.
💱Is there a chance that the uptrend that has been running on this pair since 3 October 2011 will be reversed?
💱Rather not, but a correction of the wave that has gained strength since January last year should finally take place.
💱I think we are in an ideal place to make such a correction.
💱This is due to the fact that Interest Rates in the US, have now been discounted and there is no longer as much of a push to raise them as a result of slowing inflation, and the not so terrible recession that most feared.
💱The market is still expecting one more interest rate hike tomorrow to the 4% level but given the positive sentiment and the already discounted news I think the decision may not have a significant impact on the price of the dollar with the Japanese yen.
💱 Confirming my thesis on the lower intervals we can see that from the intervention to the bottom measuring this wave. We made a correction of 50% after which we started to slide sharply, this can be seen by the size of the candles accompanying the descent standing out against the upward ones.
💱Wondering where the price might go I made 2 measurements. 1 measuring the fibo from the covid bottom which shows that the first important correction level falls to us at 0.236 which is at the price level of 140. The 2nd measurement is measuring the overbalance of the largest correction in the uptrend impulse lasting from the covid bottom which results at 143.
💱It is up to you to make a verdict on which of these levels we will see final
💱 Taking a position at the current moment the stop order will be at 148.280 and the take profit at one to one or around 143 giving us a risk/reward ratio of 3.72
🚀If you appreciate my work and effort put into this post I encourage you to leave a like and give a follow on my profile.🚀

InvestMate|AUD/CAD Monday play🦘AUD/NZD Monday play
🦘The Australian currency has begun to weaken sharply against the New Zealand dollar over the past month.
🦘The extent of the weakening since the peak has already been over 4%
🦘Friday's session did not leave a dry eye on the pair either.
🦘The weakening of the Australian currency is probably dictated by the interest rate differential which in Australia is 2.6% and in New Zealand 3.5%, almost 1% more.
🦘In my opinion, looking at the dynamics of the movement and the closing of the candle at new lows
🦘It is very likely that we will continue the downward trend on this pair on Monday.
🦘Bearing in mind that we have already made a sizable correction bouncing off the 0.382 level of the last major upward wave.
🦘As far as I can see from the levels, the road to the cluster of levels 0.382 of the largest upward wave and 0.5 of the more recent upward wave and the outer measure of the largest correction in the current downtrend at 1.618 is wide open.
🦘The zone has been respected by the price many times in the past.
🦘But I would stress that this is a long-term perspective.
🦘A more local level I would look for in the outer range of the wave of the last upward correction at the level of 1.272 of this wave.
🦘This is the 1.098 level which is a round price level.
🦘 A move to this level opening positions at current prices would be as follows.
🦘Stop order slightly above the 0.786 level.
Take profit at 1.0979 level.
🚀If you appreciate my work and effort put into this post I encourage you to leave a like and give a follow on my profile.🚀

InvestMate|NZDU/USD Time for a correction💵NZDU/USD Time for a correction
💵Quick play
💵Quick play to make a correction in the medium-term uptrend after the double top breakout on the hourly interval
💵Input at current level
💵Stop order above double top
💵Take profit at 0.57334 which is the 0.382 fibo of the upward impulse wave
🚀If you appreciate my work and effort put into this post I encourage you to leave a like and give a follow on my profile.🚀

Bearish Butterfly Harmonic Pattern DXY / Trend ReversalTrading the bearish Harmonic pattern;
Place the sell order at point D (a 127 percent extension of the XA leg). Position the stop-loss right above an extension of 161.8 percent of the XA leg(personal preference). And place the profit target at A or lower for a more aggresive take-profit since it might indicate a trend reversal.
This depends on the condition of the market.

AUDUSD SHORT (SMC)OB 4h timeframe once price et close to zone il go unto the 11 mintue time frame and finde perfect entry once that happens beatuiful short

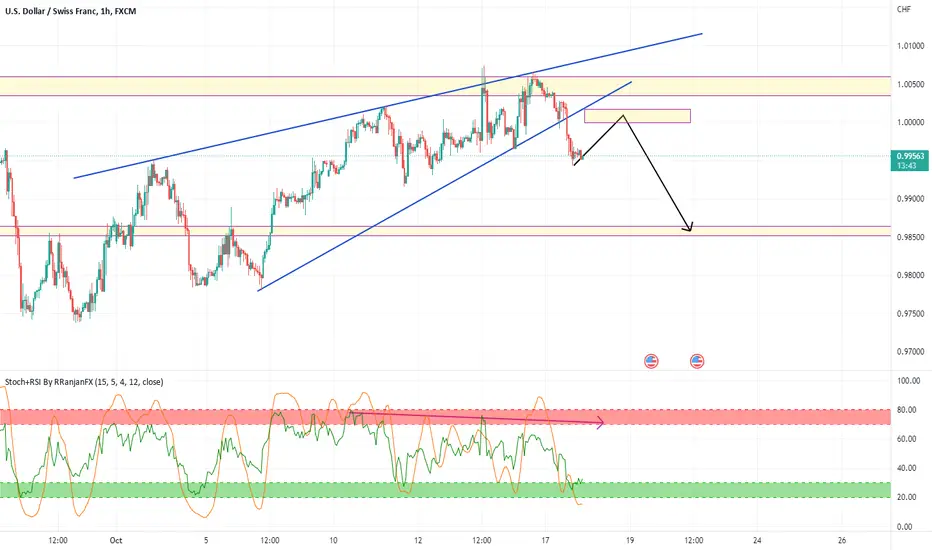
USD/CHF below 1.0001(Short Position)Hello Traders
Looks like there is no way for the USD to climb over the 1.002 in USD/CHF.
So here is why we are bearish on USD/CHF:
1- RSI and Stochastic are declining (1hr TF) and also showing RD-.
2- Rising wedge pattern has been broken.
3- Possible Double Top formation.
4- Micro momentum is bearish.
Targets have been shown in the chart.
If you like it then Support us by Like, Following and Sharing.
Thanks For Reading
Team Fortuna
-RC
(Disclaimer: Published ideas and other Contents on this page are for educational purposes and do not include a financial recommendation. Trading is Risky, so before any action do your research.)
EURUSD continuation shortLooking for a push lower.
The break of Structure would signal that this idea is invalidated

CRUDE OIL Breakout Short! Sell!
Hello,Traders!
CRUDE OIL broke the rising support
Which was somewhat unexpected
But now we are locally bearish biased
And I think that we will see
A further move down
Sell!
Like, comment and subscribe to boost your trading!
See other ideas below too!

XRP///SHORT///DOUBLE TOPHi. XRP looks like is hitting double top.
SL and TP can be different, this is my personal trade set up... 3x leverage
GL

NZD-USD Will Keep Falling! Sell!
Hello,Traders!
NZD-USD is trading in a downtrend
And the pair has formed a bearish flag pattern
So we are bearish biased on the pair
And after the breakout
A further move down
Is to be expected
Sell!
Like, comment and subscribe to boost your trading!
See other ideas below too!

EUR/CHF - SELLEUR/CHF - Sell - Short-term trade - opened trade @0.9755 - now breakeven SL risk-free trade. Conviction.
Idea for my reference only.

DXY Bearish Correction! Sell!
Hello,Traders!
DXY is trading in a massive opening wedge
And the index has retested the rising resistance
From where we are seeing
A bearish pullback, and I think
That we will see further bearish correction
Sell!
Like, comment and subscribe to boost your trading!
See other ideas below too!

GBPAUD SELL IDEAI think it's pretty clear it's going in a downtrend. I feel like it will go down to the trend line below because it has been tested multiple times before. It overall looks like a triangle pattern as well.
In a lower time frame such as 1 minute you can spot a head and shoulders pattern in current time.

Taking a Long herePLEASE DO NOT COPY WITHOUT DOING YOUR OWN ANALYSIS. This is for my own entertainment and knowledge.
Personally not fully convinced on this but just thinking how most retailers would act here and open a lot of short positions. This looks like a perfect spot to liquidate short positions. I am doing a small bet on this one but if it falls to my last by I see a big pump moving forwards
What option play you see happening RED or GREEN :)
Lets see what happens
Remember enjoy trading think like a institution not a retail investor. Lets get it!!!

BAKRISHNA IND breakdown tgt 2010 given closing below 2048support broken oi showing bearish , trendline retested at smaller time frame

EURGBP SELL trade active now!EURGBP SELL
Entry: 0.84525
SL: 0.84783
TP: 0.83400
RRR: 1:4.33
Impulsive drop down then correction

DOTUSDT - SELLHello traders,
today I have prepared an analysis of DOTUSDT for you, as with all other cryptocurrencies, we are in consolidation, which may send the price up or vice versa down after the end, but soon we will be in a very strong supply zone. After creating the signal I want to sell.
IMPORTANT WARNING:
---------------------------------------------------------------------------------------------------------------------------------------------------------------------------------------------------------------------------------------
Rebounds from marked zones created by trading positions of large institutions such as banks or various financial funds may not create new HH or LL and therefore it is very important to collect partial profits at least according to these rules. This will help you to keep your equity curve constantly growing and protect your funds from big drops if the price unexpectedly turns against you. But the decision is only in your hands.
I personally prefer setting up multiple TPs , here's an explanation:
1) 1:1 allows you to take a 50% position and thus secure a balance against loss in case the market turns
2) 2-5 :1 means profit (25% trade volume ), after reaching this TP I move SL to BE
3) 5-10 :1 means bonus money with rest of trade volume (again 25%)
Money is lying on the ground, just bend down for it! Be patient and wait for the price to reach a strong zone and open a position!

CADCHF BREAKOUT OR BOUNCE?Pair: CADCHF
Timeframe: 1D , 4H
Analysis: Round number level, trend line, volume profile, support and resistance, trend channel, ascending triangle pattern
—————
Key Takeaway: Seen alot of strength within the past few hours and CHF is significantly week and we can see this amongst all other pairs. If we break through the top of the channel we will need to see a re-test and the same amount of volatility, if we bounce we will wait for price to break support and round number
—————
Level needed: need a close by 0.74290(bullish) or 0.72985(bearish)
—————
Trade: Neutral
RISK:REWARD —
SL: —
TP: —
—————
DO NOT ENTER OUR SETUPS WITHOUT CONFIRMATION

AUDUSD - Potential ideaFX_IDC:AUDUSD
He llo everyone !
🛎 Let check the trading idea for AUDUSD
🤗 Not making anything difficult everything is pretty straightforward.
👉 1. Price goes ABOVE the selected range on the picture. Long positions to activate. 🟢
👉 2. Price goes BELOW the selected range. below. Short positions to activate. 🔴
----------------------------------------------------------------------------------------------------------------------------
⚠️ Important Notes:
1. Always follow your trading plan regarding entry, risk management, and trade management. ❗️❗️❗️
2. Timeframes: up to H4
----------------------------------------------------------------------------------------------------------------------------
😉 If you like the idea there was a like 🚀 and sign up so you can continue receiving great ideas like this one and also for us to make pattern the idea! 🤝
💪 Profitable lock for everyone! 🙏

USDJPY BREAKOUT OR BOUNCE?Pair: USDJPY
Timeframe: 4H, 1D
Analysis: Round number level, trend line, volume profile, support and resistance, pennant pattern
—————
Key Takeaway: Need either a break of top pennant and resistance for bullish swing or a bounce off these levels
—————
Level needed: need a close by 136.890(bullish) or 136.530(bearish)
—————
Trade: Neutral
RISK:REWARD —
SL: —
TP: —
—————
DO NOT ENTER OUR SETUPS WITHOUT CONFIRMATION

CADCHF BEARISH CONTINUATION TRADEPair: CADCHF
Timeframe: 4H
Analysis: Round number level, trend line, volume profile, support and resistance, descending triangle
—————
Key Takeaway: Need a break of support
—————
Level needed: need a close by 0.73760
—————
Trade: short
RISK:REWARD 1:6
SL: 13
TP: 79
—————
DO NOT ENTER OUR SETUPS WITHOUT CONFIRMATION
