CAD/JPY resistancejust a quick bit of analysis on this pair, its hit 61.8 fib and hit resistance....showing signs to continue the down trend.
Short-trend

EUR / AUD South Our friend € feels kinda tired. I feel for shorting when price comes up to 0.5 and hit bollinger middle band. Set stop-loss above last highs. Set primary target to 1.40440, secondary all the way back down at 1.39600
Good luck guys and girls.

USDJPY / 1HR / TCTPAIR: USD/JPY
TTF: 1HR
TRADE: TREND CONTINUATION TRADE
NOTE: These are potential Trade opportunities based
on my own personal Analysis.
Thank you,
Star Prosper
Philip Stewart

AUDUSD jump into the trend! Price is on the way to complete bat pattern in a very important zone. And next confluence is that Fed on Wednesday probably(almost 100%) increase the rate = usd will be stronger.

AUD/USD looking for a sell 0.77 has held up again after a 3-month bull run makes sense to reverse around here, tough resistance that has been tested 4+ times, to Buy at this point IMO we would have to maintain above 0.77500

USDJPY Quick 60 pip short!!!USDJPY have been trending then breaking trend for the past few days. Expected to crash down to previous support, then possibly another consolidation for a day, then another crash.


Intraday falling- NZDJPYBreak of hourly bullish trend. Price is doing a pullback till that trend, and then, we can expect a bearish movement till first support level.

NZDUSD- Trend Turning? I think so!Main reason why its turning, it hit a major weekly resistance zone.
Now price seems to be reacting nicely off that resistance level.
Two entry options-
1. Im waiting for a close below the trend line
2. Wait for the pullback and have a bearish engulfing candle to take the short.

US30 Flying Strong breakout after nearly 2 months of trading in range, Will be interesting to see if we get a retest of 20000

USD CAD is Making shapes! So OK. I was wrong the first time about the break out on this market and it cost me 100 pips. I learned the "wait and see" lesson (again). And a lot of the other traders did predict this spike back up into trend before the bear run.
However, what to watch for?
So this newly formed head and shoulders gives us its neck line on old support/resistance which is nice, it allows for an aggressive bearish trade off this marker, and also gives us an upper section of the forming bearish trend. I will be taking this trade which I expect to line up today, but I will be entering on Bearish candle patterns only and a clear rejection of the resistance. Ill be setting my stops above the recent shoulder but will be managing this in real time and getting out at the first sign of trouble.
A longer term and more conservative approach would be to wait for confirmation of the blue trend line and sell off this on each pass. I'll probably be doing that too, but that's one for next month.


AUDUSD: Long Term is UpThis is my view on the possible movement for AUDUSD. It can potentially form a bullish bat on the smaller time frame to let us enter for the bigger ride up. Or it can break the new resistance to form a harmonic pattern for a short into a inverted head and shoulder for an upside. I think the latter is more likely because of how price moved last week at a strong momentum up. The black arrow is the overall direction I believe this pair is going.

Going SHORT EUR/USD after Breakout in UptrendEntered at peak with a TP of 1.05613 - looking to opt out of trade after retracement is over

AUDUSD Holding DowntrendThe AUDUSD held it's current downtrend on the daily chart this past week. It tested the trend line, but failed to break above. As long as it stays below this trend line and continues to be bearish, I would remain short All the best!

Small Short Trade in USOILHere we can see an breakout and a retest on the trendline.
Could be a good chance for a small short trade.

Huge Potential Runner alert - Powerful Breakout of TRRemember to manage your position, take your profit and add when its right.
if all goes well, enjoy the ride, highly likely we will need to fasten our seat belt with this one.

EURUSD Intra-day Supports/ResistancesFollowing the Italian Constitutional Referendum , the pair is most likely to break the strong support level and make a new one. Market is also very volatile.The supports and resistances for the intra day trading are illustrated on the chart. The indicators like Stochastics also indicate that the pair is overbought. So the correction would be considered with the fundamental events.

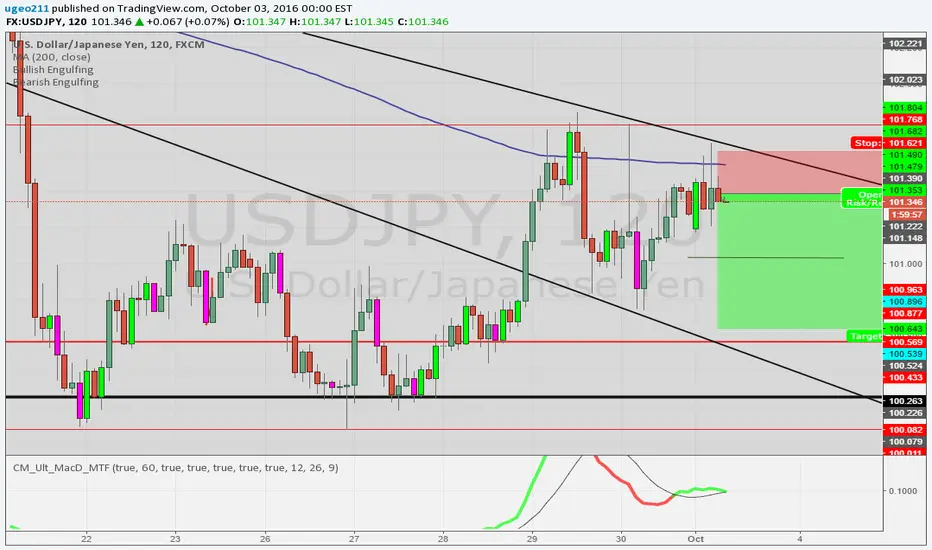
USDJPY Short off resistance Hoping to see a push down from black TL & MA as it has done in the past , may fall into a descending channel. First target is around 101.00 then 100.60
EURJPY Potential Trend Continuation Short SetupEURJPY is testing a long term trendline, lets see how it goes. Stoploss at 136 just in case it breaks the trend, targets at 126 support level and sub 120. Good Luck and Happy trading!

AUD/USD downtrend continuationAU broke support and retested only to fall back down. Dollar strength will help drive this pair down as well.

