$REN looking for a short into resistance tomorrowREN has been running for a long time ago, I made money today shorting into the resistance in the morning, so if this can gap up and shoot into the 19.50's level then I can short, tight stop though because if it keeps breaking up past 19.50's then it can easily run to 20's which I can enter for my second short.
Short-trend

UKOIL - Right Shoulders ?UKOIL - Right Shoulders ?
The question is simple - what we see on the graph of the Brent oil?
The answer is simple - we see a change quotes, changes in the derivatives of the functions of the quotes - the indicators, we see invented and drawn by us trend lines and channels, invented and drawn by us figures of Paterns - Head and shoulders such as here.
You can draw a lot more - like a wave, "... finish 5-th in C" ... and so on.
The question is simple - what all it gives us, as all it helps to determine the future movement of the price function in time?
The answer is simple - nohow!
This answer is simple and complex at the same time, it is beautiful and terrible! After all, we hope and believe, and yet know that indicators follow the quotation, it is a second-order derivatives of the price function, the wave theory of Elliott - very controversial, because it does not give the same interpretation of the function movement for two different subjects using it, and therefore unscientific.
So, what about ...? Where goes the price ...? Who knows this ...?
What we can expect, "when we going out on the track, in front of the locomotive rapid quotes" flying forward?
At the will of the gods? On the resistance and support levels, so the same - they are, they will stop it, deployed, rotated to the right, reflect!
The answer is - no matter nohow, almost ...
ALMOST! This is a magical, almost miraculous!
What is it that controls the price and what we expect?
How to manage it ALMOST?
Manage The ALMOST, is simultaneously simple and complex.
Almost - it is the psychology of each individual and mass psychology folded together.
Almost a discipline and risk management, this is your Stop Loss and Take Profit.
Almost our common integrated view to the level of prices.
What's The measure of The Almost?
Parameters of the Almost is so much, we can be measured each individually, but it is very difficult to integrate the results.
Well, so - we simplify. What is important in the ALMOST? We take only important, and discard the rest, ... at least for now put aside.
Probability, math-expectations - these are the words that make the almost a reality.
The feelings of the Price movement for the masses who will buy and sell at the same time. Whom do more - sellers or buyers?
They are - equally. Their numbers is always the same.
Not equally, changes only the intensity, the intensity of purchases and sales.
And so at any given point of time, movement of quotes.
So this intensity considered in the time and determine the price movement.
A probability - will help us to identify where.
I will not be here to write a treatise, "On the principles of enhancing math expectations, increasing the likelihood of profitable trade ..." - they have a lot of it is written.
I'm not going to predict the future price movement - there are many, analysts, elliotschikis, trade-actcionschikis etc.
Let's just say, probably the price will go lower in this particular field.
And so - and probably I'll go out on the track and stand in front of the locomotive prices.
I go small by little, step by step. To make it not hurt, in case of failure!
And then, ...
Then, success and upgrading of the, or trimmed with light injuries, jumped off the rails!
Successful traiding and Happiness foe all!
MikleKey

NZDUSD (Factors in potential NZD news)If news comes in against NZD, we'll see either a re-test of the last low or a newer low. Good R/R ratio here. Fits within trendline. Recent doji may give vision to a direction change, which coincides with trend line pattern.

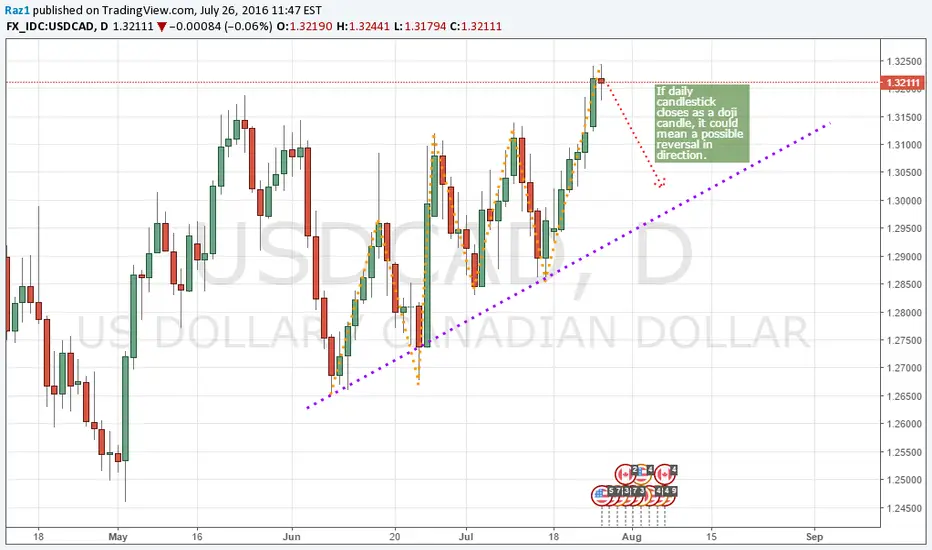
If USDCAD ends in a doji, reversal in direction?Here is a daily chart of USDCAD, as you can see, it seems to be making a trend cycle. If the daily candlestick ends as a doji it could be a possible turn in direction and a chance to short. If this happen, this short would probably be a retracement before continuing up.
Please trade using your own discretion.
USDJPY - ShortLooking like a good opportunity to short UJ. It's trading between the trend lines and just hit a resistance level from a year ago and failed to break it. This resistance is also right at the point of the trend so it'll have to break both. If it does break, we'll see a massive move up towards the ~116.00 mark.
The Stoch RSI is curently oversold and the RSI has just hit a trend line.
Trade with caution.


GBPNZD, 15minLooks like it is ready to continue down trend.
With AUD strong AUD news this pair could keep declining.

Gold Short to support I'm Looking for XAUUSD to head down to the 55-50 area , Most bullish attempts have been capped around the 1280-90's last night and there is still some room to the downside IMO . The 1270- 1275 area May provide support and will need to be cleared .
T1 - 1274.50
T2 - 1255.00 ish'

USDMXN Short to possible resistance line break, and further.I Shorted USDMXN at the break of the trend line last night before i went to bed, and woke up to a wonderful +$500. It is in a down trend on the larger time frame, so I expect it to keep moving down. Be mindful of the mini S/R line and expect a possible bounce there which could even take it back up to 17.54 where the top of the trend is. If it breaks the trend line, I will be aiming for 17.2-17.1.

is this a trend continuation move?I think it could be a rebounce on a resistance for a continuation move.
stop above 110.20
entry 108.70
tp1 105.80

USDCADShort Trade, following the trend.
High entrance, little stop.
If the trade runs in profit, you could also move your stop to the last high and eleminate the TP, but here i marked it with a RRR > 2


GBPJPY ShortGJ is approaching resistance potentially at the trend line and also at the 50 day MA (also 200MA on the 4h chart). I will be looking for a bearish signal from the candles and/or a break of the upward trend support (green line)

SHORT on USDCAD after step up in trend=> 10 and 50 MA on 4H show no sign of trend changing
=> Previous step dropped to trend line nicely
=> SHORT on this step up for good entry
=> The step does have almost a 1.00 fibs bounce
but I'm not too concerned by employing a 2:1 RR ratio

GBP/USD SELL SELL SELL Not the greatest setup
but one to start the week with great risk reward :)
reasons for
1.Price has come back up to previous support trend line and has shown imediate affect
pushing price down
2.price created a bearish engulfing
3.Looks like price just made a correction and now is ready for a big drop
also remember the trend is your friend :)


GBP/JPY Short ...Measured Move- Strong Bear Trend Bar
- Measured Move Target based on Last Big Bear Spike
- Support Below (2 Pink Lines) should act as a magnet

FX CHART OF THE DAY: BTCUSD BREAKDOWN RISKBTCUSD is trading below 1st standard deviation from weekly (120-h) mean at 257.5 amid downward slope of the mean.
Price has probability to fall further down, if it stays below the 1st standard deviation.
Traders can pick shorts close to the level (257.5) and stop at the weekly mean (262.3).
Breakdown below recent lows will confirm the trade (254.0)


Trade Setup for GBPJPYToday we will focus on short opportunity , some news are coming which can be benefit for us to make +100 pips ... best of luck !


EURUSD: Still fallingAs always this is just a projection. Looking for an entry in the green zone. Should be able to keep a tight SL.
Projecting a BEAR move to approx 1.23592. Might see a slight retracement around 1.2391 to the 4H channel but I remain confident it will push below for a continuation.
Thoughts?...
Comments?...
