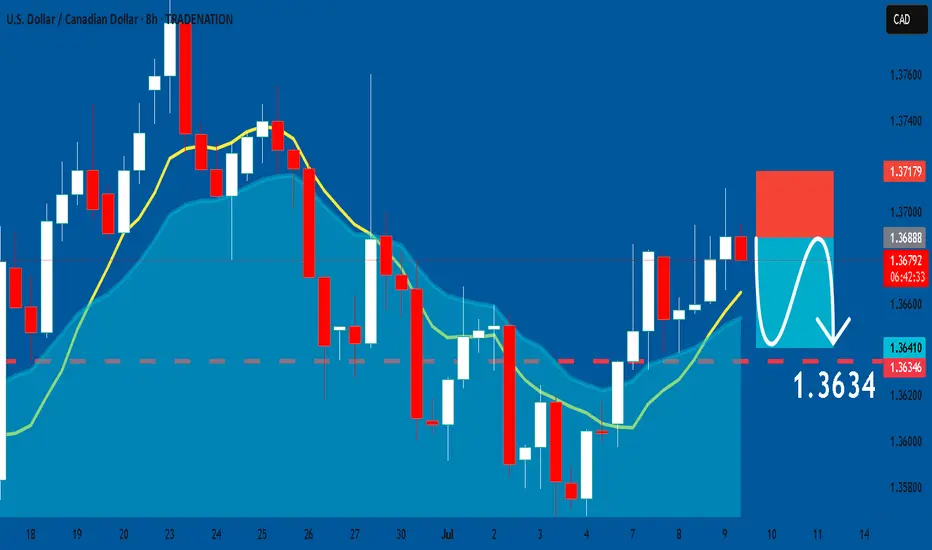
USDCAD: Bearish Continuation & Short Signal
USDCAD
- Classic bearish setup
- Our team expects bearish continuation
SUGGESTED TRADE:
Swing Trade
Short USDCAD
Entry Point - 1.3688
Stop Loss - 1.3717
Take Profit - 1.3634
Our Risk - 1%
Start protection of your profits from lower levels
Disclosure: I am part of Trade Nation's Influencer program and receive a monthly fee for using their TradingView charts in my analysis.
❤️ Please, support our work with like & comment! ❤️
Short
GBPUSD: Market of Sellers
The analysis of the GBPUSD chart clearly shows us that the pair is finally about to tank due to the rising pressure from the sellers.
Disclosure: I am part of Trade Nation's Influencer program and receive a monthly fee for using their TradingView charts in my analysis.
❤️ Please, support our work with like & comment! ❤️

GBPNZD A Fall Expected! SELL!
My dear subscribers,
This is my opinion on the GBPNZD next move:
The instrument tests an important psychological level 2.2683
Bias - Bearish
Technical Indicators: Supper Trend gives a precise Bearish signal, while Pivot Point HL predicts price changes and potential reversals in the market.
Target - 2.2655
About Used Indicators:
On the subsequent day, trading above the pivot point is thought to indicate ongoing bullish sentiment, while trading below the pivot point indicates bearish sentiment.
Disclosure: I am part of Trade Nation's Influencer program and receive a monthly fee for using their TradingView charts in my analysis.
———————————
WISH YOU ALL LUCK

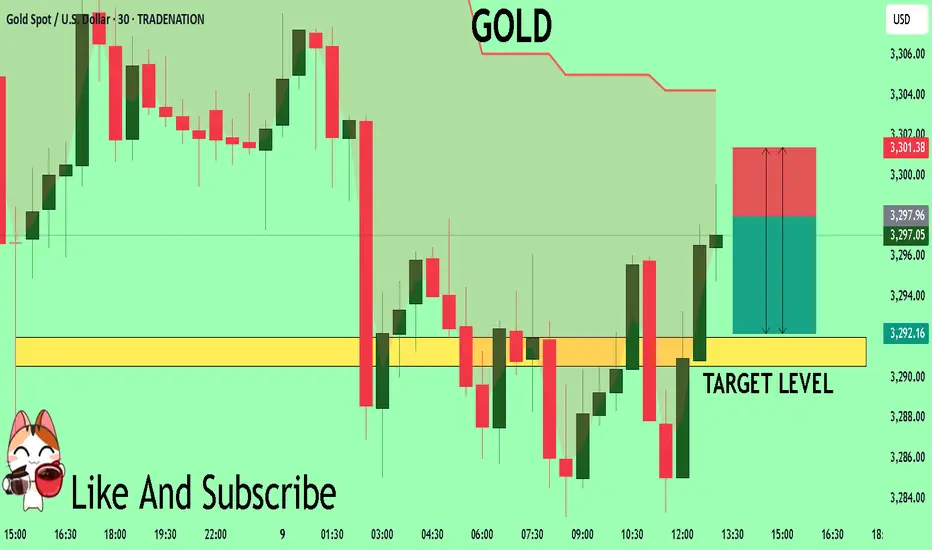
GOLD Trading Opportunity! SELL!
My dear subscribers,
My technical analysis for GOLD is below:
The price is coiling around a solid key level - 3297.6
Bias - Bearish
Technical Indicators: Pivot Points High anticipates a potential price reversal.
Super trend shows a clear sell, giving a perfect indicators' convergence.
Goal - 3291.9
My Stop Loss - 3301.3
About Used Indicators:
By the very nature of the supertrend indicator, it offers firm support and resistance levels for traders to enter and exit trades. Additionally, it also provides signals for setting stop losses
Disclosure: I am part of Trade Nation's Influencer program and receive a monthly fee for using their TradingView charts in my analysis.
———————————
WISH YOU ALL LUCK
USDJPY Will Go Down! Sell!
Here is our detailed technical review for USDJPY.
Time Frame: 1D
Current Trend: Bearish
Sentiment: Overbought (based on 7-period RSI)
Forecast: Bearish
The market is approaching a significant resistance area 146.736.
Due to the fact that we see a positive bearish reaction from the underlined area, I strongly believe that sellers will manage to push the price all the way down to 144.416 level.
P.S
We determine oversold/overbought condition with RSI indicator.
When it drops below 30 - the market is considered to be oversold.
When it bounces above 70 - the market is considered to be overbought.
Disclosure: I am part of Trade Nation's Influencer program and receive a monthly fee for using their TradingView charts in my analysis.
Like and subscribe and comment my ideas if you enjoy them!

AUDUSD Will Move Lower! Short!
Take a look at our analysis for AUDUSD.
Time Frame: 12h
Current Trend: Bearish
Sentiment: Overbought (based on 7-period RSI)
Forecast: Bearish
The market is on a crucial zone of supply 0.653.
The above-mentioned technicals clearly indicate the dominance of sellers on the market. I recommend shorting the instrument, aiming at 0.649 level.
P.S
Overbought describes a period of time where there has been a significant and consistent upward move in price over a period of time without much pullback.
Disclosure: I am part of Trade Nation's Influencer program and receive a monthly fee for using their TradingView charts in my analysis.
Like and subscribe and comment my ideas if you enjoy them!

USOIL BEST PLACE TO SELL FROM|SHORT
USOIL SIGNAL
Trade Direction: short
Entry Level: 68.26
Target Level: 63.78
Stop Loss: 71.23
RISK PROFILE
Risk level: medium
Suggested risk: 1%
Timeframe: 9h
Disclosure: I am part of Trade Nation's Influencer program and receive a monthly fee for using their TradingView charts in my analysis.
✅LIKE AND COMMENT MY IDEAS✅

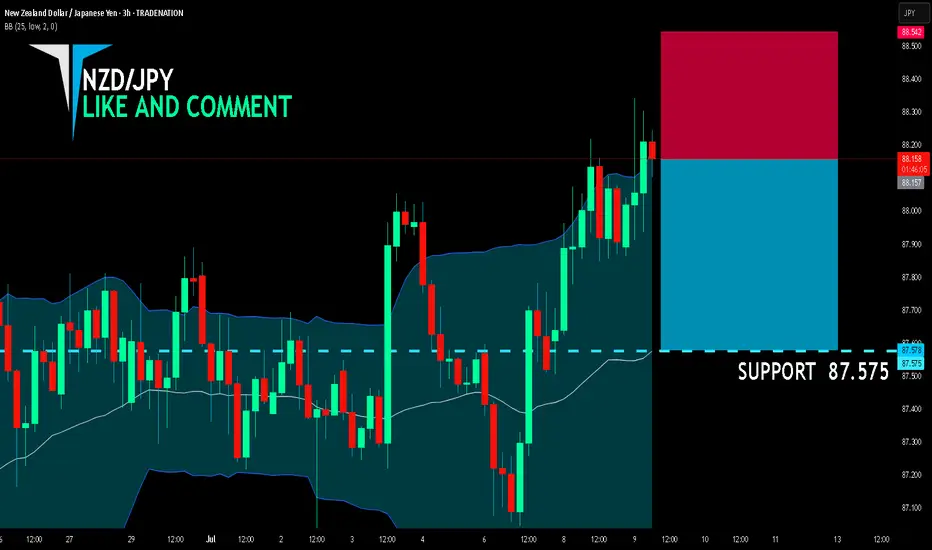
NZD/JPY BEARS ARE STRONG HERE|SHORT
NZD/JPY SIGNAL
Trade Direction: short
Entry Level: 88.157
Target Level: 87.575
Stop Loss: 88.542
RISK PROFILE
Risk level: medium
Suggested risk: 1%
Timeframe: 3h
Disclosure: I am part of Trade Nation's Influencer program and receive a monthly fee for using their TradingView charts in my analysis.
✅LIKE AND COMMENT MY IDEAS✅
CAD/JPY SHORT FROM RESISTANCE
Hello, Friends!
CAD/JPY is making a bullish rebound on the 3H TF and is nearing the resistance line above while we are generally bearish biased on the pair due to our previous 1W candle analysis, thus making a trend-following short a good option for us with the target being the 106.671 level.
Disclosure: I am part of Trade Nation's Influencer program and receive a monthly fee for using their TradingView charts in my analysis.
✅LIKE AND COMMENT MY IDEAS✅

AUD/JPY BEARS WILL DOMINATE THE MARKET|SHORT
Hello, Friends!
The BB upper band is nearby so AUD/JPY is in the overbought territory. Thus, despite the uptrend on the 1W timeframe I think that we will see a bearish reaction from the resistance line above and a move down towards the target at around 95.252.
Disclosure: I am part of Trade Nation's Influencer program and receive a monthly fee for using their TradingView charts in my analysis.
✅LIKE AND COMMENT MY IDEAS✅

EUR/CHF BEARS WILL DOMINATE THE MARKET|SHORT
Hello, Friends!
EUR/CHF pair is trading in a local downtrend which know by looking at the previous 1W candle which is red. On the 1H timeframe the pair is going up. The pair is overbought because the price is close to the upper band of the BB indicator. So we are looking to sell the pair with the upper BB line acting as resistance. The next target is 0.934 area.
Disclosure: I am part of Trade Nation's Influencer program and receive a monthly fee for using their TradingView charts in my analysis.
✅LIKE AND COMMENT MY IDEAS✅

HYPE — Targeting Liquidity Below Monday Low1. While below Monday low — bearish, target liquidity
2. TP1: 35.34
3. TP2: 30.60
4. Above Monday low = scenario invalid

Running Flat FormationHere we have a Running Flat Formation. At point C it looks to me that price has broken the small upward trend it was in and has imprinted a H&S formation and broken to the downside. I'm waiting for a retest on the previous new structure low (NSL) before taking an entry.

GBPJPY: Bearish Forecast & Outlook
Looking at the chart of GBPJPY right now we are seeing some interesting price action on the lower timeframes. Thus a local move down seems to be quite likely.
Disclosure: I am part of Trade Nation's Influencer program and receive a monthly fee for using their TradingView charts in my analysis.
❤️ Please, support our work with like & comment! ❤️

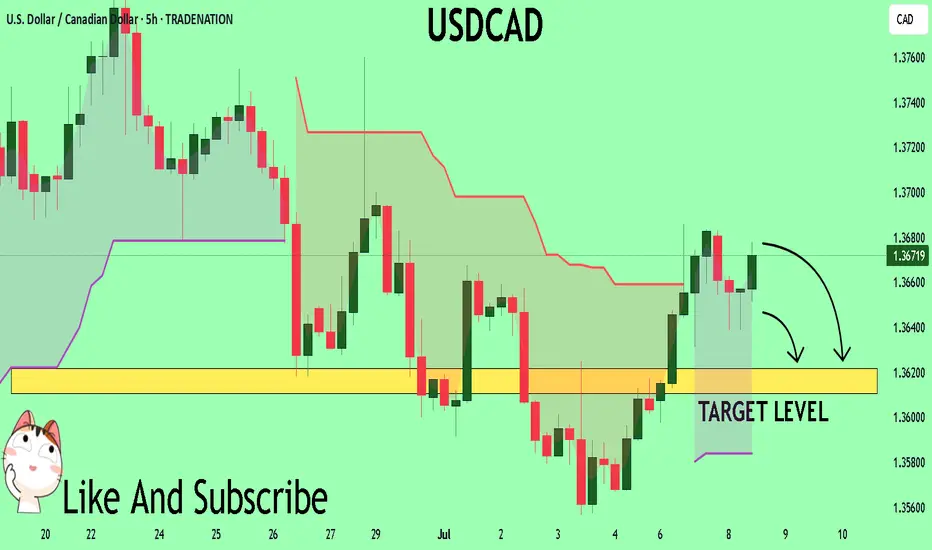
USDCAD My Opinion! SELL!
My dear friends,
Please, find my technical outlook for USDCAD below:
The price is coiling around a solid key level - 1.3669
Bias - Bearish
Technical Indicators: Pivot Points High anticipates a potential price reversal.
Super trend shows a clear sell, giving a perfect indicators' convergence.
Goal - 1.3621
About Used Indicators:
The pivot point itself is simply the average of the high, low and closing prices from the previous trading day.
Disclosure: I am part of Trade Nation's Influencer program and receive a monthly fee for using their TradingView charts in my analysis.
———————————
WISH YOU ALL LUCK
US30 Is Bearish! Sell!
Please, check our technical outlook for US30.
Time Frame: 12h
Current Trend: Bearish
Sentiment: Overbought (based on 7-period RSI)
Forecast: Bearish
The price is testing a key resistance 44,371.8.
Taking into consideration the current market trend & overbought RSI, chances will be high to see a bearish movement to the downside at least to 43,586.3 level.
P.S
Please, note that an oversold/overbought condition can last for a long time, and therefore being oversold/overbought doesn't mean a price rally will come soon, or at all.
Disclosure: I am part of Trade Nation's Influencer program and receive a monthly fee for using their TradingView charts in my analysis.
Like and subscribe and comment my ideas if you enjoy them!

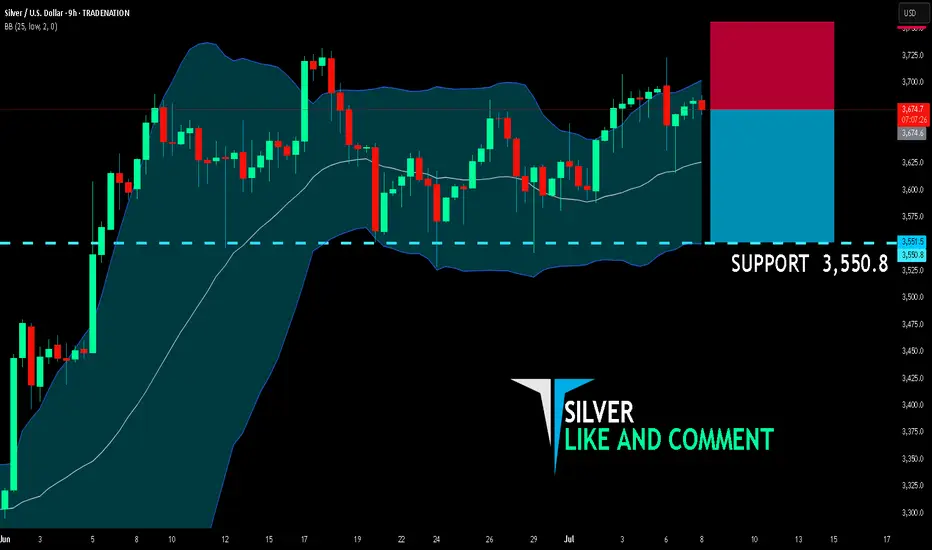
SILVER SENDS CLEAR BEARISH SIGNALS|SHORT
SILVER SIGNAL
Trade Direction: short
Entry Level: 3,674.6
Target Level: 3,550.8
Stop Loss: 3,756.2
RISK PROFILE
Risk level: medium
Suggested risk: 1%
Timeframe: 9h
Disclosure: I am part of Trade Nation's Influencer program and receive a monthly fee for using their TradingView charts in my analysis.
✅LIKE AND COMMENT MY IDEAS✅
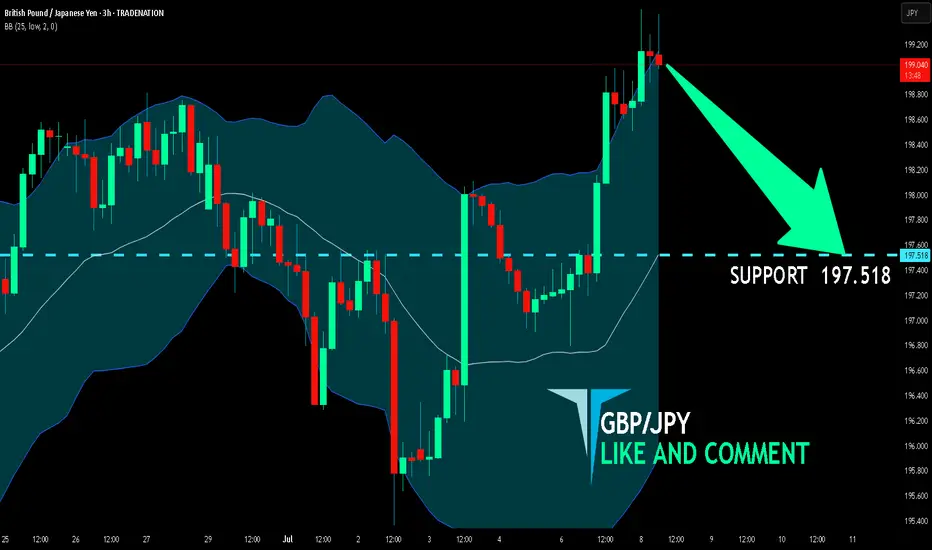
GBP/JPY SELLERS WILL DOMINATE THE MARKET|SHORT
Hello, Friends!
Previous week’s green candle means that for us the GBP/JPY pair is in the uptrend. And the current movement leg was also up but the resistance line will be hit soon and upper BB band proximity will signal an overbought condition so we will go for a counter-trend short trade with the target being at 197.518.
Disclosure: I am part of Trade Nation's Influencer program and receive a monthly fee for using their TradingView charts in my analysis.
✅LIKE AND COMMENT MY IDEAS✅
AUD/USD Short: Riding the Perfect Storm to 0.6400Hello, traders! 🚀
A rare and powerful setup is forming on AUD/USD, and all signs are pointing decisively lower. 👇 This isn't just a simple technical pattern; it's a perfect storm of fundamental, technical, and event-driven factors aligning to create a high-conviction short opportunity.
If you're looking for a clean setup with a clear catalyst, this is it. Let's break it down! 🧐
The Core Thesis: Why We're Bearish 🌪️
This trade is built on three powerful pillars that are converging at the same time:
Massive Policy Divergence: 🇺🇸 vs 🇦🇺 This is the engine of the trade.
The Fed (USD): Remains HAWKISH 🦅. They are laser-focused on fighting stubborn inflation and have signaled they are in no rush to cut rates.
The RBA (AUD): Is actively DOVISH 🐨. They've already cut rates and are widely expected to cut again this week to support a weakening economy.
Result: This widening gap in interest rate policy creates a fundamental tailwind that heavily favors a stronger USD and a weaker AUD. 💸
The Dual-Catalyst Event (July 9th): 🗓️ This is the trigger.
FOMC Minutes Release: The minutes from the Fed's last meeting are expected to confirm their hawkish stance, reinforcing USD strength.
Tariff Deadline: A 90-day suspension of Trump-era tariffs expires on the same day . The base case is that tariffs will be reimposed, sparking a risk-off move in the markets.
Result: Risk-off sentiment is toxic for the risk-sensitive Aussie dollar (AUD) and a magnet for the safe-haven US dollar (USD). This is a potential double-whammy for AUD/USD. 💥
The Technical Picture is Screaming "Down" 📉
The chart tells a crystal-clear story of rejection and weakness. As you can see on the 4H chart, the price action is incredibly bearish after failing to break out higher.
The Great Wall of Resistance: Bulls threw everything they had at the 0.6590 - 0.6600 resistance zone and were decisively rejected. 🧱 This wasn't just any level; it was an 8-month high and a major long-term resistance area. A failure this strong is a huge red flag for buyers. 🛑
Momentum has Flipped: We saw classic bearish divergence on the higher timeframes, and as you can see on this 4H chart, we have now decisively broken below the recent rising channel. The path of least resistance has flipped from up to down. 👇
The Trade Plan 🎯
Here are the precise levels for executing this trade idea.
Asset: AUD/USD
Direction: Short (Sell) 📉
Entry Zone: ➡️ Look for a patient entry on a pullback to the 0.6535 - 0.6550 area. This was previous support and is now expected to act as strong resistance. We want to sell into strength.
Stop Loss: 🛑 A daily close above 0.6610 . This level is safely above the recent highs. A break here would invalidate our bearish thesis.
Target 1 (TP1): ✅ 0.6475 . This is the first logical support level. A good area to take partial profits and move your stop loss to break-even.
Target 2 (TP2): 🏆 0.6400 . This is our primary target, representing the bottom of the multi-week trading range and offering an excellent risk-to-reward ratio.
Conclusion: 💡
It's rare for fundamentals, technicals, and a major event catalyst to align so perfectly. The rejection at major resistance, combined with the powerful fundamental driver of policy divergence and the upcoming dual-catalyst on July 9th, makes this a high-conviction setup.
This is my analysis and not financial advice. Always do your own research and manage your risk carefully.
What do you think? Are you bearish on the Aussie too? Let me know your thoughts in the comments below! 👇
And if you found this analysis helpful, please give it a BOOST 🚀 and FOLLOW for more trade ideas! 👍

NZD/JPY: Bearish Wedge Before RBNZ CatalystThis is a high-conviction trade idea for NZD/JPY , where a perfect storm of technical and fundamental factors is aligning for a significant short opportunity. The setup is clean, the reasoning is strong, and we have a clear catalyst on the horizon. 🚀
Fundamental Analysis 🌪️
The macro picture is the primary driver here, creating a powerful bearish case.
1️⃣ Monetary Policy Divergence (🇳🇿 vs 🇯🇵): This is the core engine of the trade. The Reserve Bank of New Zealand (RBNZ) is dovish, signaling rate cuts amid a fragile domestic economy. In stark contrast, the Bank of Japan (BoJ) is hawkish, having started a historic policy normalization to combat persistent inflation. This fundamental clash is strongly bearish for NZD/JPY.
2️⃣ Risk-Off Catalyst (🇺🇸): The market is nervous ahead of the July 9th US tariff deadline . This uncertainty is creating a classic "risk-off" environment, which typically strengthens the safe-haven JPY and weakens risk-sensitive currencies like the NZD.
3️⃣ The RBNZ Decision (🏦): The main event on July 9. The market expects a "dovish hold," meaning even if rates are unchanged, the forward guidance will likely be very cautious, highlighting economic risks and signaling future cuts. This is the catalyst that could trigger the sell-off.
Technical Analysis 📉
The 4H chart provides crystal-clear confirmation of the fundamental weakness.
1️⃣ Bearish Rising Wedge: Price is being squeezed into a classic bearish reversal pattern. This shows that buying pressure is exhausted, and the market is preparing for a move to the downside.
2️⃣ Key Resistance Zone: The wedge is pushing directly into a heavy supply zone between 87.80 and 88.00 . This area has acted as a firm brick wall 🧱, rejecting multiple attempts to move higher.
3️⃣ RSI Momentum: The RSI below the chart confirms the weakening momentum. It's failing to show strong bullish power, which supports the price action and signals that the uptrend is running out of steam. 💨
The Trade Plan 🎯
Based on this analysis, the plan is to enter with a limit order to get an optimal entry price on a potential final spike into resistance.
Direction: Short (Sell) 📉
Order Type: Limit Sell
Entry: 87.80 📍
Stop Loss: 88.40 🛡️
Take Profit: 86.00 💰
Risk/Reward Ratio: 1:3 ⭐⭐⭐
This setup presents a rare confluence of fundamental divergence, technical weakness, and a clear catalyst.
Trade safe and manage your risk.

QQQ Massive Short! SELL!
My dear subscribers,
QQQ looks like it will make a good move, and here are the details:
The market is trading on 556.22 pivot level.
Bias - Bearish
My Stop Loss - 564.94
Technical Indicators: Both Super Trend & Pivot HL indicate a highly probable Bearish continuation.
Target - 542.15
About Used Indicators:
The average true range (ATR) plays an important role in 'Supertrend' as the indicator uses ATR to calculate its value. The ATR indicator signals the degree of price volatility.
Disclosure: I am part of Trade Nation's Influencer program and receive a monthly fee for using their TradingView charts in my analysis.
———————————
WISH YOU ALL LUCK

EURUSD Buyers In Panic! SELL!
My dear friends,
My technical analysis for EURUSD is below:
The market is trading on 1.1775 pivot level.
Bias - Bearish
Technical Indicators: Both Super Trend & Pivot HL indicate a highly probable Bearish continuation.
Target - 1.1648
Recommended Stop Loss - 1.1840
About Used Indicators:
A pivot point is a technical analysis indicator, or calculations, used to determine the overall trend of the market over different time frames.
Disclosure: I am part of Trade Nation's Influencer program and receive a monthly fee for using their TradingView charts in my analysis.
———————————
WISH YOU ALL LUCK

CADJPY: Short Trading Opportunity
CADJPY
- Classic bearish formation
- Our team expects fall
SUGGESTED TRADE:
Swing Trade
Sell CADJPY
Entry Level - 106.89
Sl - 107.40
Tp - 105.90
Our Risk - 1%
Start protection of your profits from lower levels
Disclosure: I am part of Trade Nation's Influencer program and receive a monthly fee for using their TradingView charts in my analysis.
❤️ Please, support our work with like & comment! ❤️
