AUDUSD – Bearish Breakdown Below EMA Support🚀👆 Boost it if you like it...👆🚀
Price has broken decisively below the EMA cluster after consolidating in a tight range. The strong bearish candle suggests momentum toward lower support levels.
Trade Plan:
✅ Entry:
Current price ~0.65545
✅ Stop Loss:
Above 0.657722 (last minor swing high)
✅ Target:
0.65340 – 0.6500 area (previous demand and round number support)
Context:
• EMA confluence failure
• Clear bearish momentum candle
• Clean risk-to-reward setup
Risk Management:
Risk per trade: 1%
Hashtags:
#AUDUSD #ForexSignals #PriceAction #Breakdown #MJTrading #TradingIdea #Forex
Short

GOLD: Short Signal with Entry/SL/TP
GOLD
- Classic bearish pattern
- Our team expects retracement
SUGGESTED TRADE:
Swing Trade
Sell GOLD
Entry - 3349.3
Stop - 3353.5
Take - 3339.9
Our Risk - 1%
Start protection of your profits from lower levels
Disclosure: I am part of Trade Nation's Influencer program and receive a monthly fee for using their TradingView charts in my analysis.
❤️ Please, support our work with like & comment! ❤️

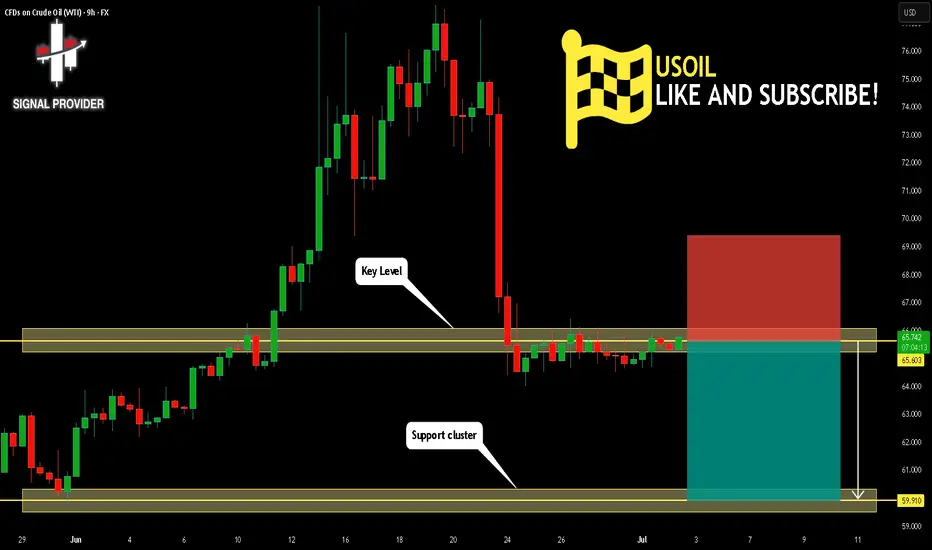
USOIL Will Fall! Sell!
Take a look at our analysis for USOIL.
Time Frame: 9h
Current Trend: Bearish
Sentiment: Overbought (based on 7-period RSI)
Forecast: Bearish
The market is testing a major horizontal structure 65.603.
Taking into consideration the structure & trend analysis, I believe that the market will reach 59.910 level soon.
P.S
The term oversold refers to a condition where an asset has traded lower in price and has the potential for a price bounce.
Overbought refers to market scenarios where the instrument is traded considerably higher than its fair value. Overvaluation is caused by market sentiments when there is positive news.
Disclosure: I am part of Trade Nation's Influencer program and receive a monthly fee for using their TradingView charts in my analysis.
Like and subscribe and comment my ideas if you enjoy them!
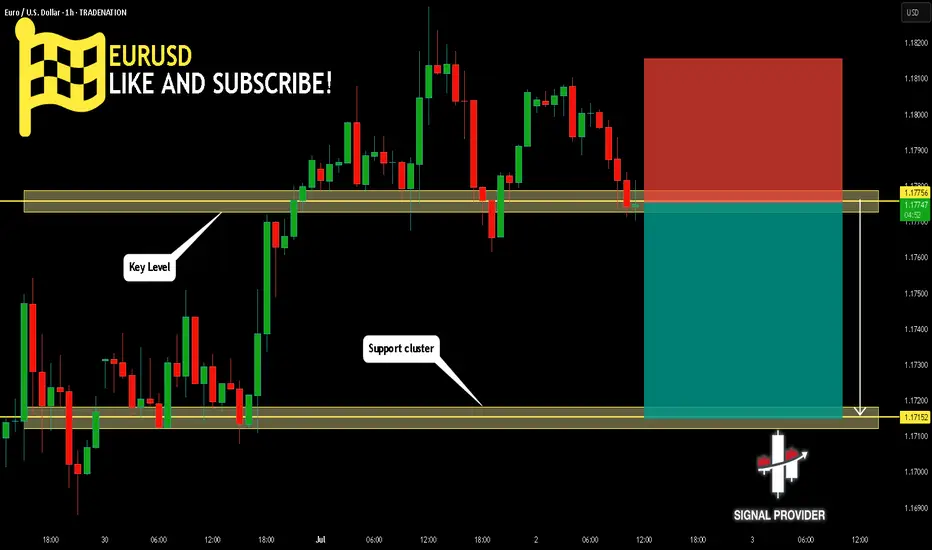
EURUSD Will Go Down From Resistance! Short!
Please, check our technical outlook for EURUSD.
Time Frame: 1h
Current Trend: Bearish
Sentiment: Overbought (based on 7-period RSI)
Forecast: Bearish
The market is approaching a key horizontal level 1.177.
Considering the today's price action, probabilities will be high to see a movement to 1.171.
P.S
We determine oversold/overbought condition with RSI indicator.
When it drops below 30 - the market is considered to be oversold.
When it bounces above 70 - the market is considered to be overbought.
Disclosure: I am part of Trade Nation's Influencer program and receive a monthly fee for using their TradingView charts in my analysis.
Like and subscribe and comment my ideas if you enjoy them!
USDCHF Will Go Lower! Sell!
Here is our detailed technical review for USDCHF.
Time Frame: 2h
Current Trend: Bearish
Sentiment: Overbought (based on 7-period RSI)
Forecast: Bearish
The market is approaching a significant resistance area 0.792.
Due to the fact that we see a positive bearish reaction from the underlined area, I strongly believe that sellers will manage to push the price all the way down to 0.785 level.
P.S
Overbought describes a period of time where there has been a significant and consistent upward move in price over a period of time without much pullback.
Disclosure: I am part of Trade Nation's Influencer program and receive a monthly fee for using their TradingView charts in my analysis.
Like and subscribe and comment my ideas if you enjoy them!

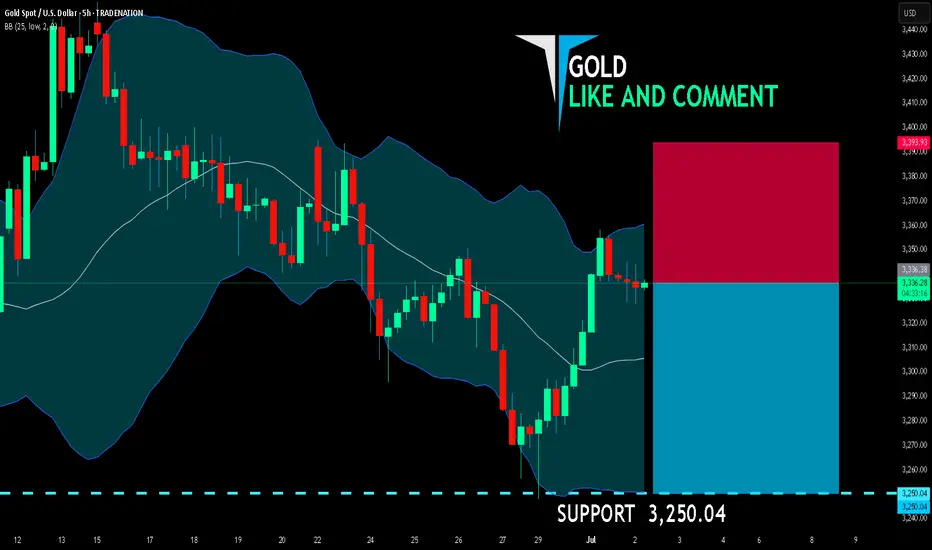
GOLD BEARS ARE STRONG HERE|SHORT
GOLD SIGNAL
Trade Direction: short
Entry Level: 3,336.38
Target Level: 3,250.04
Stop Loss: 3,393.93
RISK PROFILE
Risk level: medium
Suggested risk: 1%
Timeframe: 5h
Disclosure: I am part of Trade Nation's Influencer program and receive a monthly fee for using their TradingView charts in my analysis.
✅LIKE AND COMMENT MY IDEAS✅
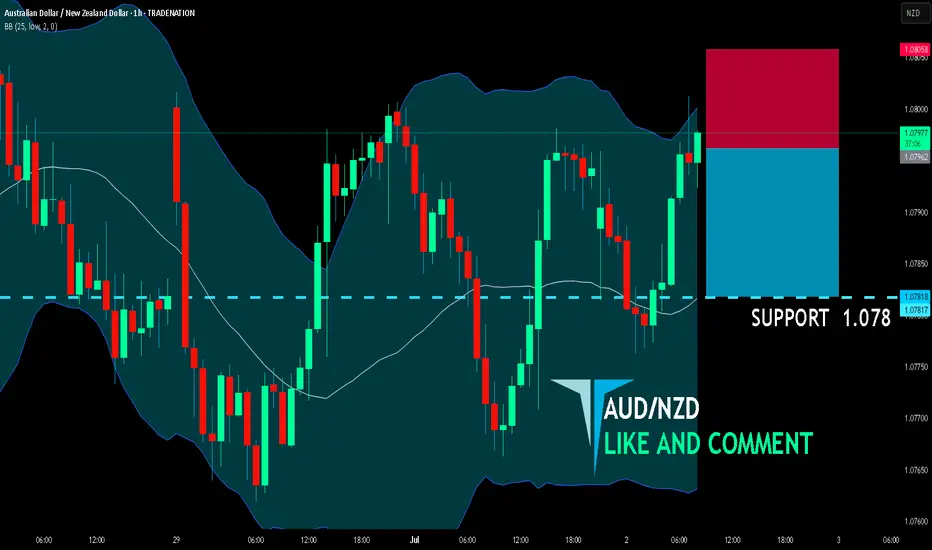
AUD/NZD SHORT FROM RESISTANCE
AUD/NZD SIGNAL
Trade Direction: short
Entry Level: 1.079
Target Level: 1.078
Stop Loss: 1.080
RISK PROFILE
Risk level: medium
Suggested risk: 1%
Timeframe: 1h
Disclosure: I am part of Trade Nation's Influencer program and receive a monthly fee for using their TradingView charts in my analysis.
✅LIKE AND COMMENT MY IDEAS✅
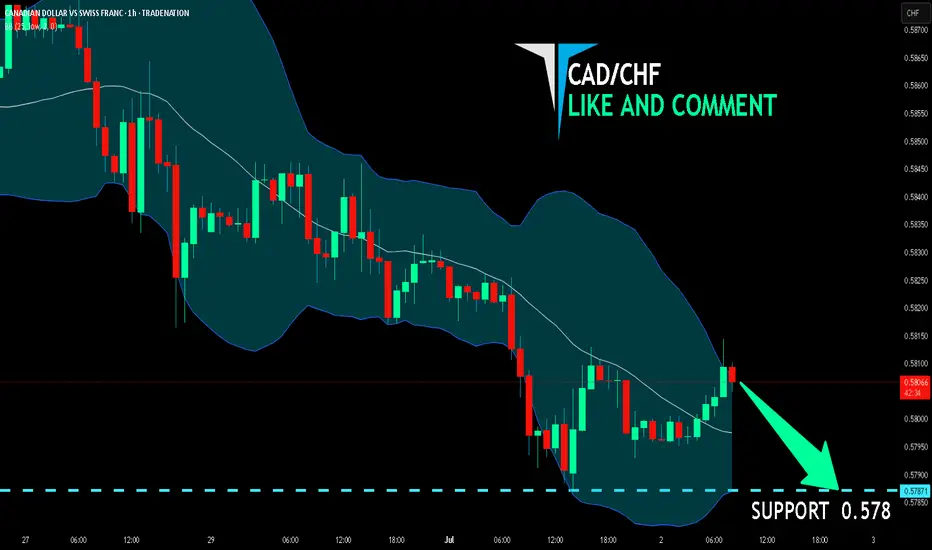
CAD/CHF BEARS WILL DOMINATE THE MARKET|SHORT
Hello, Friends!
We are targeting the 0.578 level area with our short trade on CAD/CHF which is based on the fact that the pair is overbought on the BB band scale and is also approaching a resistance line above thus going us a good entry option.
Disclosure: I am part of Trade Nation's Influencer program and receive a monthly fee for using their TradingView charts in my analysis.
✅LIKE AND COMMENT MY IDEAS✅
AUD/JPY SENDS CLEAR BEARISH SIGNALS|SHORT
Hello, Friends!
We are now examining the AUD/JPY pair and we can see that the pair is going up locally while also being in a uptrend on the 1W TF. But there is also a powerful signal from the BB upper band being nearby, indicating that the pair is overbought so we can go short from the resistance line above and a target at 93.578 level.
Disclosure: I am part of Trade Nation's Influencer program and receive a monthly fee for using their TradingView charts in my analysis.
✅LIKE AND COMMENT MY IDEAS✅

HYPEUSDT Probably CookedToken driven by demand from trading on Hyperliquid. Crypto looks set for a few month long consolidation probably into Q4.
That loss in trading volume will reduce demand for the token and the company may be forced to sell the token to come up with large gains for its clients. Either way it's a bearish catalyst for the token which has really ran hard. Ugly head and shoulders as well as a topping pattern in an overall financial market that looks like it wants a pull back

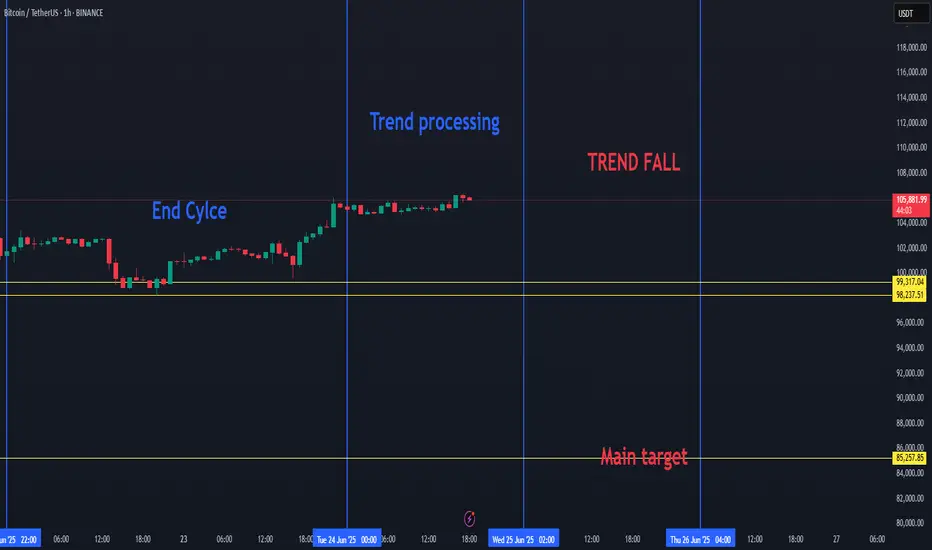
BTC HIGH DATA SHOW BREAKDOWN TO 85K FOR BITCOIN SOON.Bitcoin Market Update
BTC SEEMS TO ENTER A NEW CORRECTION PHASE SOON.
Recent data suggests that the current Bitcoin (BTC) cycle is coming to an end. As a result, we may soon see a downward move in BTC's price. The key target in this potential drop is around $85,000, with expectations that BTC will fall below $100,000.
This week, Bitcoin completed its cycle trend and is now entering a processing or transitional phase. Once this phase ends, we anticipate another decline in price.
This outlook is based on recurring patterns seen in previous BTC cycles, which have shown similar behavior in the past.
BTC can play on the low time frame with uptrends and downtrends, but if we will choice a side, then it will be the red trend.. since BTC cycle is ending.
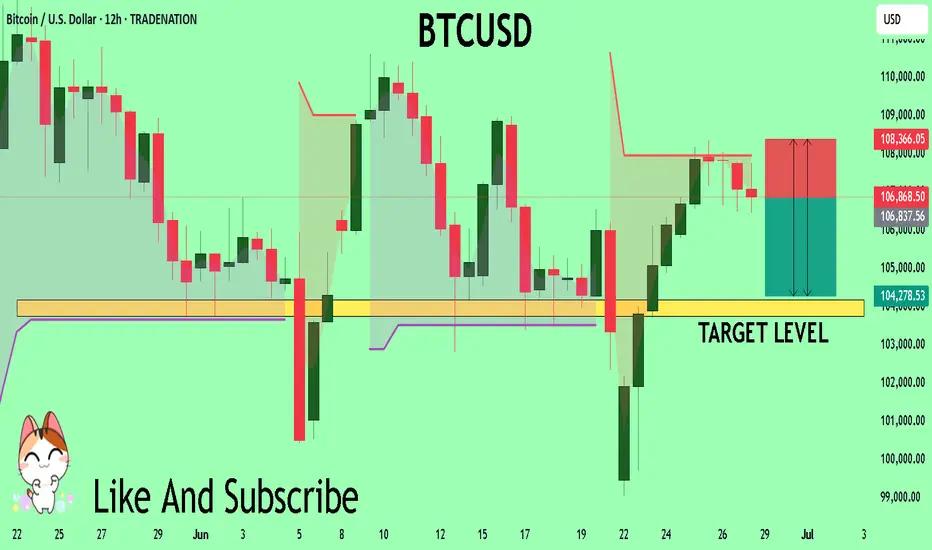
Bitcoin can turn around from seller zone and start to declineHello traders, I want share with you my opinion about Bitcoin. The price previously broke above the support line and made a strong bullish move from the buyer zone (99300–100500 points). After the breakout, the price started rising steadily and is now approaching the Seller Zone (108500–109500), which also coincides with the resistance line of the downward channel. This area has shown strong bearish pressure in the past. Every time the price entered this zone, it quickly reversed. It’s a key area where many traders seek short-term opportunities. Currently, price is just entering this zone again and showing early signs of weakening momentum. Given the channel's structure, past price behavior near this resistance level, and the presence of the seller zone, I expect BTCUSD to turn around soon. Once the price rejects this level, I anticipate a reversal and a move back into the channel, continuing the downward trajectory. My first target is set at 103000 points, near the center of the range and above the support level (100500). This area has been tested multiple times before and may act as a strong buffer again. Please share this idea with your friends and click Boost 🚀
Disclaimer: As part of ThinkMarkets’ Influencer Program, I am sponsored to share and publish their charts in my analysis.

BTCUSD Trading Opportunity! SELL!
My dear subscribers,
This is my opinion on the BTCUSD next move:
The instrument tests an important psychological level 10686
Bias - Bearish
Technical Indicators: Supper Trend gives a precise Bearish signal, while Pivot Point HL predicts price changes and potential reversals in the market.
Target - 10417
My Stop Loss - 10836
About Used Indicators:
On the subsequent day, trading above the pivot point is thought to indicate ongoing bullish sentiment, while trading below the pivot point indicates bearish sentiment.
Disclosure: I am part of Trade Nation's Influencer program and receive a monthly fee for using their TradingView charts in my analysis.
———————————
WISH YOU ALL LUCK
QQQ A Fall Expected! SELL!
My dear subscribers,
This is my opinion on the QQQ next move:
The instrument tests an important psychological level 548.21
Bias - Bearish
Technical Indicators: Supper Trend gives a precise Bearish signal, while Pivot Point HL predicts price changes and potential reversals in the market.
Target - 535.27
About Used Indicators:
On the subsequent day, trading above the pivot point is thought to indicate ongoing bullish sentiment, while trading below the pivot point indicates bearish sentiment.
Disclosure: I am part of Trade Nation's Influencer program and receive a monthly fee for using their TradingView charts in my analysis.
———————————
WISH YOU ALL LUCK

EURO - Price can start to decline from resistance line of wedgeHi guys, this is my overview for EURUSD, feel free to check it and write your feedback in comments👊
Some days ago price grew to $1.1500 level and even broke it, after which started to decline in wedge.
Price declined to support line, breaking two levels, after which it turned around and started to move up.
Soon, EUR broke $1.1215 level and then rose more, after which made a correction to support line.
Then price in a short time rose to $1.1500 level, broke it one more time, and tried to grow more, but failed.
But recently it turned around and quickly rose to resistance line of wedge and now trades near.
In my mind, Euro can bounce from resistance line and fall to $1.1520 support line of wedge pattern.
If this post is useful to you, you can support me with like/boost and advice in comments❤️
Disclaimer: As part of ThinkMarkets’ Influencer Program, I am sponsored to share and publish their charts in my analysis.

AUDUSD Buyers In Panic! SELL!
My dear subscribers,
AUDUSD looks like it will make a good move, and here are the details:
The market is trading on 0.6571 pivot level.
Bias - Bearish
My Stop Loss - 0.6603
Technical Indicators: Both Super Trend & Pivot HL indicate a highly probable Bearish continuation.
Target - 0.6511
About Used Indicators:
The average true range (ATR) plays an important role in 'Supertrend' as the indicator uses ATR to calculate its value. The ATR indicator signals the degree of price volatility.
Disclosure: I am part of Trade Nation's Influencer program and receive a monthly fee for using their TradingView charts in my analysis.
———————————
WISH YOU ALL LUCK

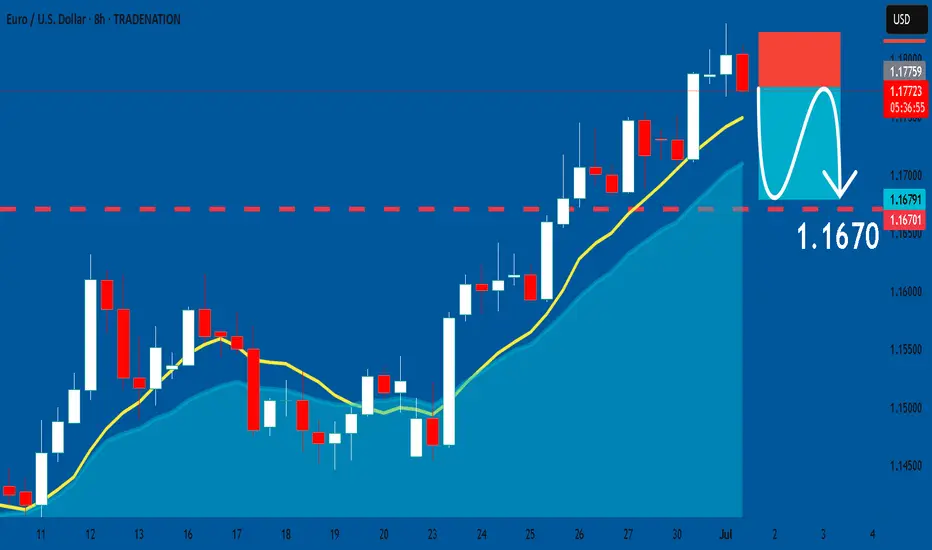
EURUSD: Short Signal Explained
EURUSD
- Classic bearish setup
- Our team expects bearish continuation
SUGGESTED TRADE:
Swing Trade
Short EURUSD
Entry Point - 1.1775
Stop Loss - 1.1822
Take Profit - 1.1670
Our Risk - 1%
Start protection of your profits from lower levels
Disclosure: I am part of Trade Nation's Influencer program and receive a monthly fee for using their TradingView charts in my analysis.
❤️ Please, support our work with like & comment! ❤️
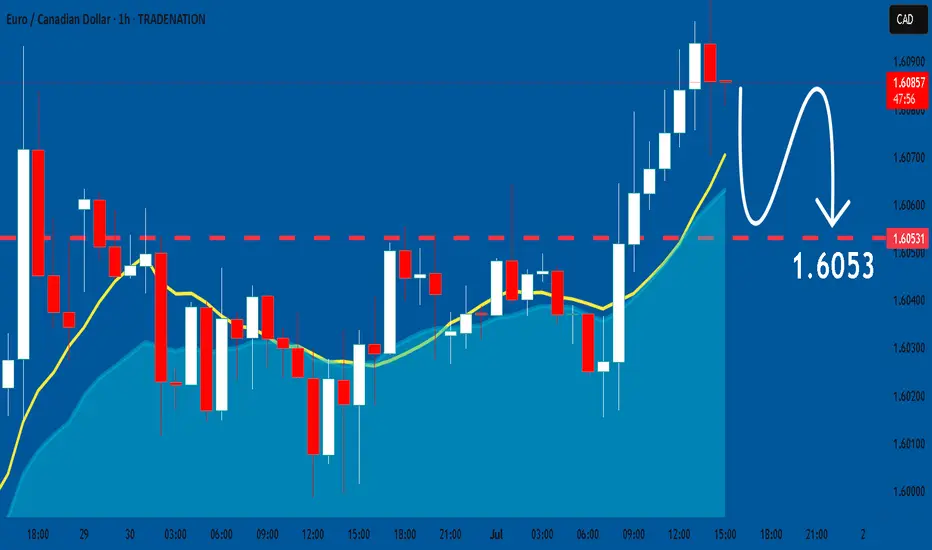
EURCAD: Expecting Bearish Continuation! Here is Why:
The recent price action on the EURCAD pair was keeping me on the fence, however, my bias is slowly but surely changing into the bearish one and I think we will see the price go down.
Disclosure: I am part of Trade Nation's Influencer program and receive a monthly fee for using their TradingView charts in my analysis.
❤️ Please, support our work with like & comment! ❤️
GOLD Massive Short! SELL!
My dear followers,
This is my opinion on the GOLD next move:
The asset is approaching an important pivot point 3350.4
Bias - Bearish
Safe Stop Loss - 3363.2
Technical Indicators: Supper Trend generates a clear short signal while Pivot Point HL is currently determining the overall Bearish trend of the market.
Goal - 3328.2
About Used Indicators:
For more efficient signals, super-trend is used in combination with other indicators like Pivot Points.
Disclosure: I am part of Trade Nation's Influencer program and receive a monthly fee for using their TradingView charts in my analysis.
———————————
WISH YOU ALL LUCK

ETH | H12 Supply Rejection & Demand Bounce PlanSELL ZONE $2,520–2,560
→ Short from supply, rejection expected
Triple tap + SFP = short trigger
↓
EQ LOWS $2,380–2,400
→ TP1 / watch for bounce
↓
BUY ZONE $2,280–2,320
→ Main long zone, enter on confirmation (bullish candle/SFP)
STOP below $2,250 = cancel idea
↑
TP1 $2,500
TP2 $2,900–3,000 (if strong bounce)
Main scenario — short from supply zone, target demand at $2,280–2,320. Long only if bounce is strong. Stop below $2,250. No confirmation — no trade.

EURJPY SHORT DAILY FORECAST Q3 D1 W27 Y25EURJPY SHORT DAILY FORECAST Q3 D1 W27 Y25
Professional Risk Managers👋
Welcome back to another FRGNT chart update📈
Diving into some Forex setups using predominantly higher time frame order blocks alongside confirmation breaks of structure.
Let’s see what price action is telling us today! 👀
💡Here are some trade confluences📝
✅Daily Order block identified
✅4H Order Block identified
✅1H Order Block identified
🔑 Remember, to participate in trading comes always with a degree of risk, therefore as professional risk managers it remains vital that we stick to our risk management plan as well as our trading strategies.
📈The rest, we leave to the balance of probabilities.
💡Fail to plan. Plan to fail.
🏆It has always been that simple.
❤️Good luck with your trading journey, I shall see you at the very top.
🎯Trade consistent, FRGNT X


CADJPY Is Very Bearish! Short!
Take a look at our analysis for CADJPY.
Time Frame: 4h
Current Trend: Bearish
Sentiment: Overbought (based on 7-period RSI)
Forecast: Bearish
The market is testing a major horizontal structure 105.190.
Taking into consideration the structure & trend analysis, I believe that the market will reach 104.340 level soon.
P.S
Overbought describes a period of time where there has been a significant and consistent upward move in price over a period of time without much pullback.
Disclosure: I am part of Trade Nation's Influencer program and receive a monthly fee for using their TradingView charts in my analysis.
Like and subscribe and comment my ideas if you enjoy them!
