EURUSD Pull BAck - Long term Target 1.200Looking for the pull to prior day lows. Long term target for EURUSD 1.200.
Short

US30 - ShortLooking for the Short on US30 final pull back before we see extension to the upside 45,000.

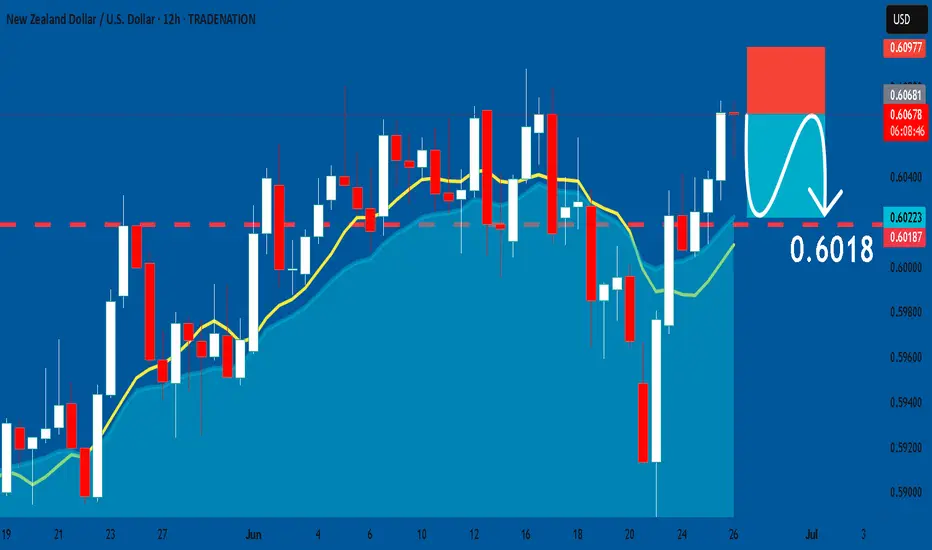
NZDUSD: Short Signal Explained
NZDUSD
- Classic bearish setup
- Our team expects bearish continuation
SUGGESTED TRADE:
Swing Trade
Short NZDUSD
Entry Point - 0.6067
Stop Loss - 0.6097
Take Profit - 0.6018
Our Risk - 1%
Start protection of your profits from lower levels
Disclosure: I am part of Trade Nation's Influencer program and receive a monthly fee for using their TradingView charts in my analysis.
❤️ Please, support our work with like & comment! ❤️
How about another RR2 Short?Lets try for a RR2 Sell..
Entry: 107100
SL: 108500
TP1: 106000
TP2:104800
See below for Reason and Full Analysis:

AAVE: Bearish Range Play — Watching for Move Back to Monday Low✅ Break above Monday high rejected, confirming resistance
✅ Structure is bearish — main scenario is return to Monday low ($221.56)
✅ Watch for reaction at target for partial profit taking
Active Scenario:
Hold/enter shorts while below Monday high
Target: $221.56 (Monday low)
Partial profit: On first touch of Monday low
Watch: Price reaction for potential reversal/setup at Monday low
🔔 Triggers & Confirmations:
Only consider reversal/long on strong bounce or reclaim at Monday low
Remain bearish while price is under Monday high
🚨 Risk Warning:
Local trend is bearish — don’t fight structure until reversal is confirmed

BTC Short from H1 FVG + H4 OB Confluence — Risky Setup✅ Price in strong supply confluence (H1 FVG + H4 OB)
✅ SFP & order block add to short case, but context is choppy
⚠️ Trade is low conviction, manage size and stops accordingly
Short Scenario:
Entry: In $107,500–$108,500 zone (confirmation from SFP/OB)
Target: $104,000–$105,000 (D1 FVG zone)
Stop: Above $108,500 or invalidate on strong reclaim
🔔 Triggers & Confirmations:
Look for reaction (SFP, rejection wicks) in FVG/OB zone before adding
Exit quick if invalidated or strong momentum up
🚨 Risk Warning:
Not a high conviction setup; use smaller position size and stay nimble

EURUSD Will Move Lower! Short!
Please, check our technical outlook for EURUSD.
Time Frame: 15h
Current Trend: Bearish
Sentiment: Overbought (based on 7-period RSI)
Forecast: Bearish
The price is testing a key resistance 1.173.
Taking into consideration the current market trend & overbought RSI, chances will be high to see a bearish movement to the downside at least to 1.144 level.
P.S
Overbought describes a period of time where there has been a significant and consistent upward move in price over a period of time without much pullback.
Disclosure: I am part of Trade Nation's Influencer program and receive a monthly fee for using their TradingView charts in my analysis.
Like and subscribe and comment my ideas if you enjoy them!

AUD/USD BEARISH BIAS RIGHT NOW| SHORT
AUD/USD SIGNAL
Trade Direction: short
Entry Level: 0.653
Target Level: 0.647
Stop Loss: 0.657
RISK PROFILE
Risk level: medium
Suggested risk: 1%
Timeframe: 9h
Disclosure: I am part of Trade Nation's Influencer program and receive a monthly fee for using their TradingView charts in my analysis.
✅LIKE AND COMMENT MY IDEAS✅

NZD/USD BEST PLACE TO SELL FROM|SHORT
Hello, Friends!
NZD/USD is trending down which is evident from the red colour of the previous weekly candle. However, the price has locally surged into the overbought territory. Which can be told from its proximity to the BB upper band. Which presents a classical trend following opportunity for a short trade from the resistance line above towards the demand level of 0.983.
Disclosure: I am part of Trade Nation's Influencer program and receive a monthly fee for using their TradingView charts in my analysis.
✅LIKE AND COMMENT MY IDEAS✅

Euro may start to decline to support line of upward channelHello traders, I want share with you my opinion about Euro. Earlier, the price was trading inside a downward wedge, gradually making lower highs and lower lows. After reaching the bottom of the wedge near the buyer zone (1.1210 - 1.1180), we saw a strong bullish impulse that broke through both the resistance line of the wedge and the support area near 1.1450 - 1.1485. This breakout signaled the beginning of a new phase - a transition into an Upward Channel. Since then, the price has been forming higher highs and higher lows, respecting both the upper and lower boundaries of this new structure. Along the way, it has rebounded from the support line multiple times and recently made a strong move up toward the resistance line of the channel. Currently, the price is approaching that resistance line, which may act as a potential reversal area. Given the previous price behavior and the clearly defined channel, I expect the price to reach the top boundary and then start to decline toward the lower support line. That’s why I’ve set my TP 1 at 1.1555 points, which aligns perfectly with the support line of the upward channel. Based on the recent breakout, the structure of the trend, and the reaction from key zones, I remain short-biased for the upcoming sessions. Please share this idea with your friends and click Boost 🚀
Disclaimer: As part of ThinkMarkets’ Influencer Program, I am sponsored to share and publish their charts in my analysis.

GOLD - Price can continue to move down in falling channelHi guys, this is my overview for XAUUSD, feel free to check it and write your feedback in comments👊
Some days ago price bounced from support level and started to grow to $3400 level, making a small correction before.
When it reached this level, price entered to wedge, where it made a correction and then started to grow.
In a short time, price exited from wedge and soon broke $3400 level, but then it started to decline in a falling channel.
In falling channel, Gold broke $3400 level one more time and in a short time declined to $3305 support level.
After this movement, Gold turned around and started to move up to resistance line of channel.
I expect that Gold can reach resistance line of channel and then start to decline to $3295 support area.
If this post is useful to you, you can support me with like/boost and advice in comments❤️
Disclaimer: As part of ThinkMarkets’ Influencer Program, I am sponsored to share and publish their charts in my analysis.

NATGAS Will Collapse! SELL!
My dear friends,
Please, find my technical outlook for NATGAS below:
The instrument tests an important psychological level 3.896
Bias - Bearish
Technical Indicators: Supper Trend gives a precise Bearish signal, while Pivot Point HL predicts price changes and potential reversals in the market.
Target - 3.662
Recommended Stop Loss - 4.034
About Used Indicators:
Super-trend indicator is more useful in trending markets where there are clear uptrends and downtrends in price.
Disclosure: I am part of Trade Nation's Influencer program and receive a monthly fee for using their TradingView charts in my analysis.
———————————
WISH YOU ALL LUCK

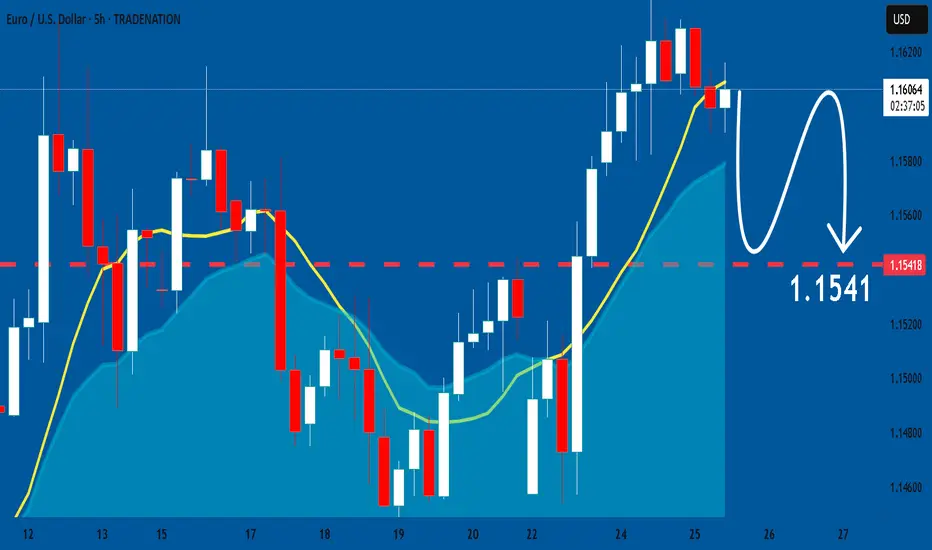
EURUSD Set To Fall! SELL!
My dear subscribers,
My technical analysis for EURUSD is below:
The price is coiling around a solid key level - 1.1521
Bias - Bearish
Technical Indicators: Pivot Points Low anticipates a potential price reversal.
Super trend shows a clear sell, giving a perfect indicators' convergence.
Goal - 1.1496
About Used Indicators:
By the very nature of the supertrend indicator, it offers firm support and resistance levels for traders to enter and exit trades. Additionally, it also provides signals for setting stop losses
Disclosure: I am part of Trade Nation's Influencer program and receive a monthly fee for using their TradingView charts in my analysis.
———————————
WISH YOU ALL LUCK
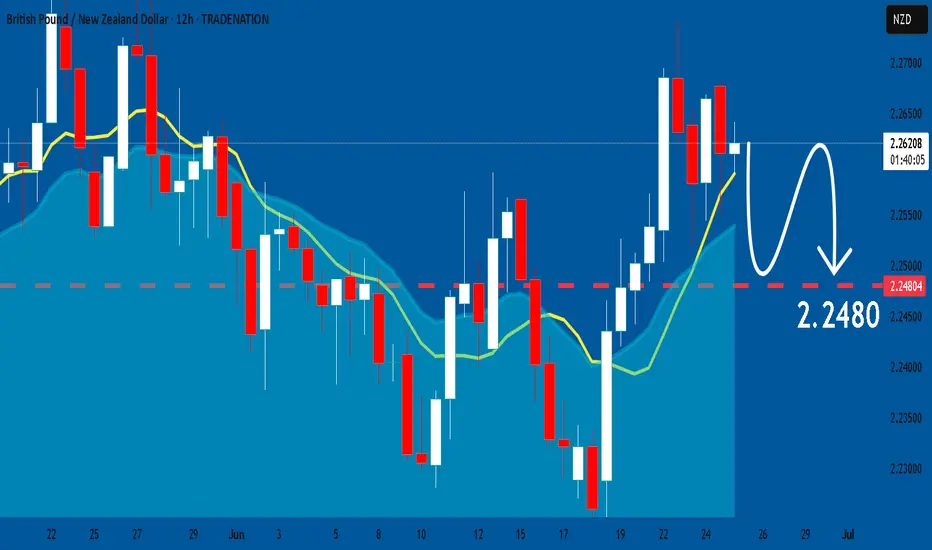
GBPNZD: Forecast & Trading Plan
The price of GBPNZD will most likely collapse soon enough, due to the supply beginning to exceed demand which we can see by looking at the chart of the pair.
Disclosure: I am part of Trade Nation's Influencer program and receive a monthly fee for using their TradingView charts in my analysis.
❤️ Please, support our work with like & comment! ❤️
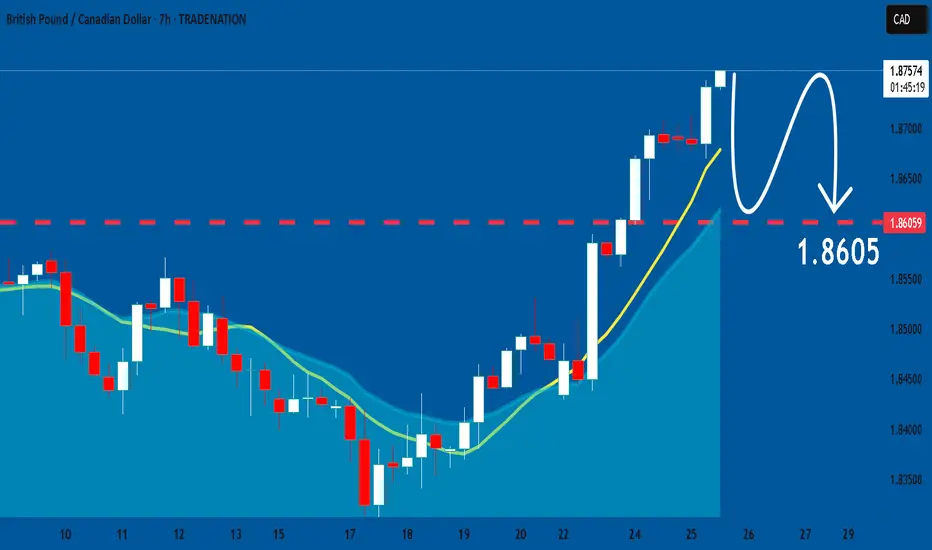
GBPCAD: Bearish Continuation & Short Signal
Our strategy, polished by years of trial and error has helped us identify what seems to be a great trading opportunity and we are here to share it with you as the time is ripe for us to sell GBPCAD.
Disclosure: I am part of Trade Nation's Influencer program and receive a monthly fee for using their TradingView charts in my analysis.
❤️ Please, support our work with like & comment! ❤️
NZDJPY Buyers In Panic! SELL!
My dear subscribers,
My technical analysis for NZDJPY is below:
The price is coiling around a solid key level - 87.737
Bias - Bearish
Technical Indicators: Pivot Points Low anticipates a potential price reversal.
Super trend shows a clear sell, giving a perfect indicators' convergence.
Goal - 87.205
My Stop Loss - 87.976
About Used Indicators:
By the very nature of the supertrend indicator, it offers firm support and resistance levels for traders to enter and exit trades. Additionally, it also provides signals for setting stop losses
Disclosure: I am part of Trade Nation's Influencer program and receive a monthly fee for using their TradingView charts in my analysis.
———————————
WISH YOU ALL LUCK

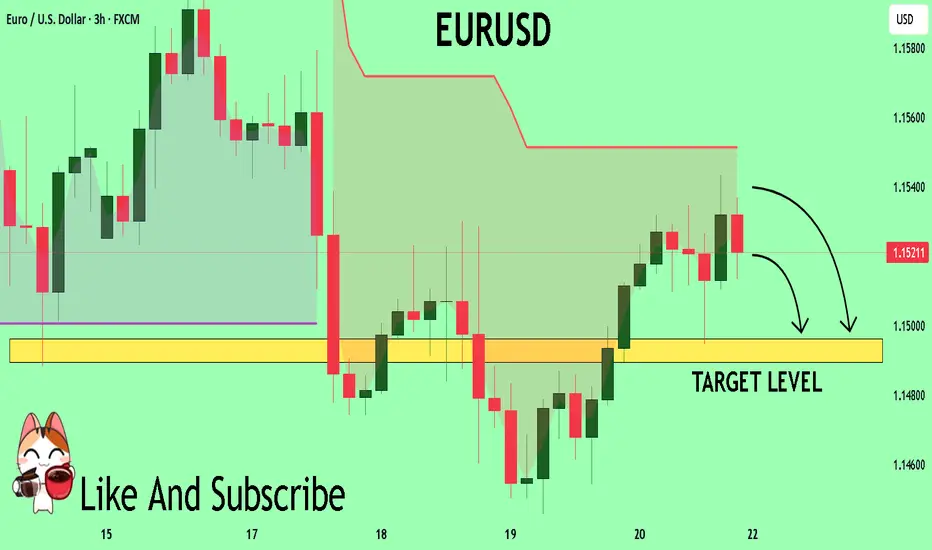
EURUSD: Expecting Bearish Continuation! Here is Why:
The recent price action on the EURUSD pair was keeping me on the fence, however, my bias is slowly but surely changing into the bearish one and I think we will see the price go down.
Disclosure: I am part of Trade Nation's Influencer program and receive a monthly fee for using their TradingView charts in my analysis.
❤️ Please, support our work with like & comment! ❤️
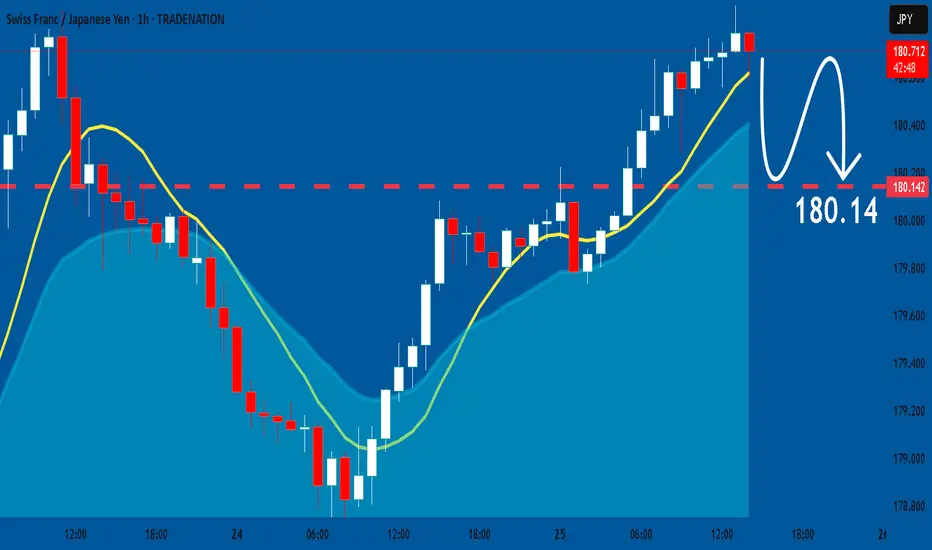
CHFJPY: Bearish Forecast & Bearish Scenario
It is essential that we apply multitimeframe technical analysis and there is no better example of why that is the case than the current CHFJPY chart which, if analyzed properly, clearly points in the downward direction.
Disclosure: I am part of Trade Nation's Influencer program and receive a monthly fee for using their TradingView charts in my analysis.
❤️ Please, support our work with like & comment! ❤️
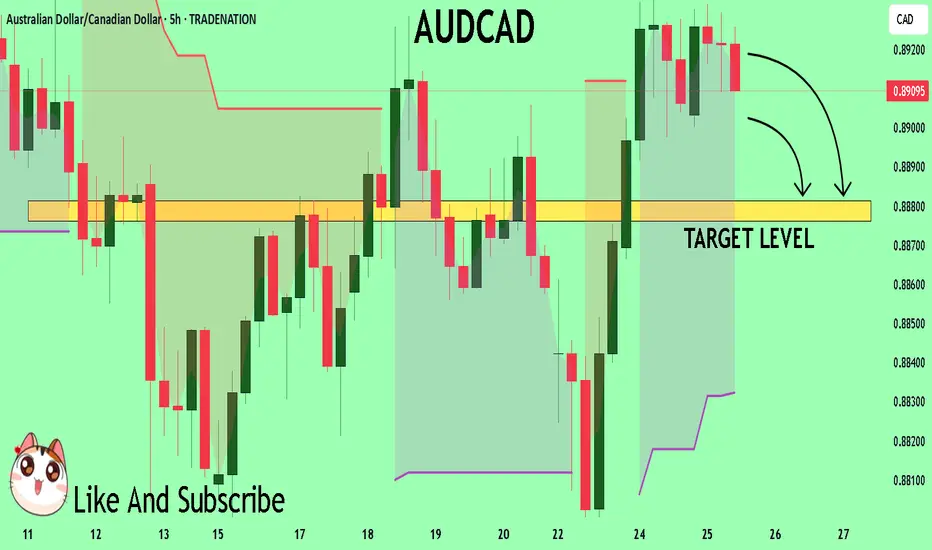
AUDCAD Massive Short! SELL!
My dear friends,
AUDCAD looks like it will make a good move, and here are the details:
The market is trading on 0.8911 pivot level.
Bias - Bearish
Technical Indicators: Supper Trend generates a clear short signal while Pivot Point HL is currently determining the overall Bearish trend of the market.
Goal - 0.8881
About Used Indicators:
Pivot points are a great way to identify areas of support and resistance, but they work best when combined with other kinds of technical analysis
Disclosure: I am part of Trade Nation's Influencer program and receive a monthly fee for using their TradingView charts in my analysis.
———————————
WISH YOU ALL LUCK
AUDJPY Under Pressure! SELL!
My dear subscribers,
This is my opinion on the AUDJPY next move:
The instrument tests an important psychological level 94.650
Bias - Bearish
Technical Indicators: Supper Trend gives a precise Bearish signal, while Pivot Point HL predicts price changes and potential reversals in the market.
Target - 94.434
About Used Indicators:
On the subsequent day, trading above the pivot point is thought to indicate ongoing bullish sentiment, while trading below the pivot point indicates bearish sentiment.
Disclosure: I am part of Trade Nation's Influencer program and receive a monthly fee for using their TradingView charts in my analysis.
———————————
WISH YOU ALL LUCK

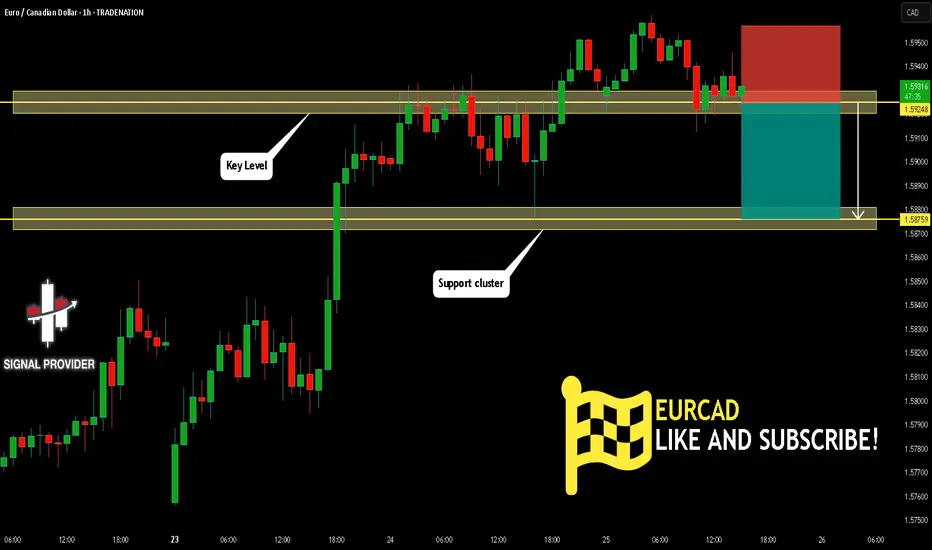
EURCAD Will Fall! Sell!
Here is our detailed technical review for EURCAD.
Time Frame: 1h
Current Trend: Bearish
Sentiment: Overbought (based on 7-period RSI)
Forecast: Bearish
The market is approaching a significant resistance area 1.592.
Due to the fact that we see a positive bearish reaction from the underlined area, I strongly believe that sellers will manage to push the price all the way down to 1.587 level.
P.S
Overbought describes a period of time where there has been a significant and consistent upward move in price over a period of time without much pullback.
Disclosure: I am part of Trade Nation's Influencer program and receive a monthly fee for using their TradingView charts in my analysis.
Like and subscribe and comment my ideas if you enjoy them!
GBPCAD Will Go Down From Resistance! Short!
Please, check our technical outlook for GBPCAD.
Time Frame: 5h
Current Trend: Bearish
Sentiment: Overbought (based on 7-period RSI)
Forecast: Bearish
The price is testing a key resistance 1.868.
Taking into consideration the current market trend & overbought RSI, chances will be high to see a bearish movement to the downside at least to 1.855 level.
P.S
The term oversold refers to a condition where an asset has traded lower in price and has the potential for a price bounce.
Overbought refers to market scenarios where the instrument is traded considerably higher than its fair value. Overvaluation is caused by market sentiments when there is positive news.
Disclosure: I am part of Trade Nation's Influencer program and receive a monthly fee for using their TradingView charts in my analysis.
Like and subscribe and comment my ideas if you enjoy them!

EUR/USD BEARS WILL DOMINATE THE MARKET|SHORT
EUR/USD SIGNAL
Trade Direction: short
Entry Level: 1.161
Target Level: 1.141
Stop Loss: 1.174
RISK PROFILE
Risk level: medium
Suggested risk: 1%
Timeframe: 10h
Disclosure: I am part of Trade Nation's Influencer program and receive a monthly fee for using their TradingView charts in my analysis.
✅LIKE AND COMMENT MY IDEAS✅
