EUR/USD SHORT FROM RESISTANCE
Hello, Friends!
We are now examining the EUR/USD pair and we can see that the pair is going up locally while also being in a uptrend on the 1W TF. But there is also a powerful signal from the BB upper band being nearby, indicating that the pair is overbought so we can go short from the resistance line above and a target at 1.143 level.
Disclosure: I am part of Trade Nation's Influencer program and receive a monthly fee for using their TradingView charts in my analysis.
✅LIKE AND COMMENT MY IDEAS✅
Short

Sell Limit Setup above 2025 High📉 AUD/USD – 2H Chart Analysis
🕒 Published: June 16, 2025 | TF: 2H
🔔 Trade Idea: 2x Sell Limit at Key Resistance Zone
🔹 Market Context:
Price is trading within a rising broadening wedge pattern (marked by the white and blue trendlines).
Current rally retraced aggressively toward upper wedge resistance (2025 High), an area that has repeatedly capped bullish momentum.
Price approaching previous supply zone.
🔻 Sell Limit Setup 1
Entry: 0.65400
SL: 0.6584
TP: 0.6503
R:R ≈ 1
➕ Fades rally into resistance
➕ Aligns with EMA structure and intraday exhaustion
🔻 Sell Limit Setup 2
Entry: 0.6550
SL: 0.6584
TP: 0.6499
R:R ≈ 2
➕ Higher entry into wick zone (liquidity trap)
➕ Potential false breakout above structure
➕ SL above key swing high = cleaner invalidation
⚠️ Aggressive short: smaller SL, better RR

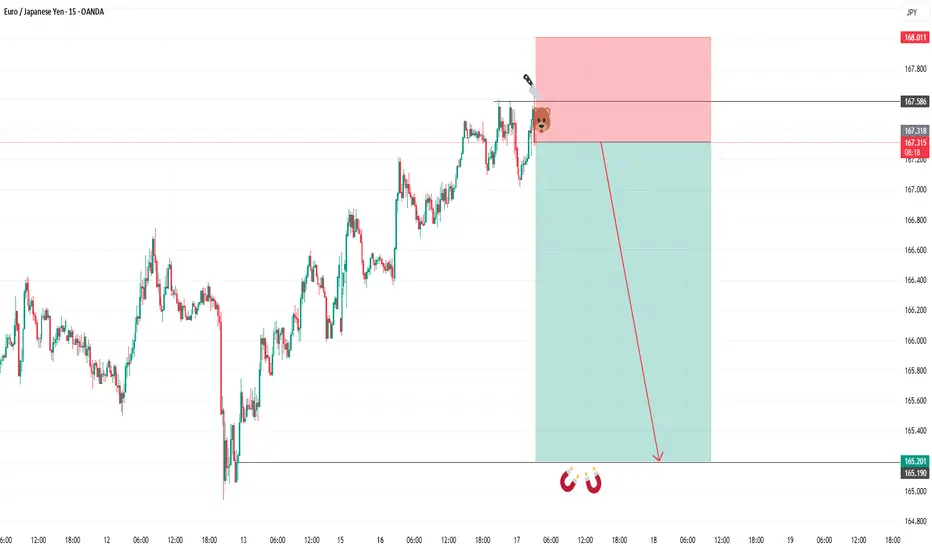
SELL EURJPYIn todays session we are monitoring EURJPY for selling opportunity. Our entry is at 167.302 our stop is above 168.000 and targets are below 165.200. Use proper risk management and remember the stop loss should be adjusted based on your risk management, sometimes it can be too tight or it can be extended depending on validity of a set up . Cheers to you all.
EURUSD SHORT FORECAST Q2 W25 D17 Y25EURUSD SHORT FORECAST Q2 W25 D17 Y25
Professional Risk Managers👋
Welcome back to another FRGNT chart update📈
Diving into some Forex setups using predominantly higher time frame order blocks alongside confirmation breaks of structure.
Let’s see what price action is telling us today!
💡Here are some trade confluences📝
✅Weekly order block rejection
✅15' order block
✅4 hour order block identified
✅Tokyo ranges to be filled
🔑 Remember, to participate in trading comes always with a degree of risk, therefore as professional risk managers it remains vital that we stick to our risk management plan as well as our trading strategies.
📈The rest, we leave to the balance of probabilities.
💡Fail to plan. Plan to fail.
🏆It has always been that simple.
❤️Good luck with your trading journey, I shall see you at the very top.
🎯Trade consistent, FRGNT X

EURNZD Massive Short! SELL!
My dear subscribers,
EURNZD looks like it will make a good move, and here are the details:
The market is trading on 1.9194 pivot level.
Bias - Bearish
My Stop Loss - 1.9246
Technical Indicators: Both Super Trend & Pivot HL indicate a highly probable Bearish continuation.
Target - 1.9095
About Used Indicators:
The average true range (ATR) plays an important role in 'Supertrend' as the indicator uses ATR to calculate its value. The ATR indicator signals the degree of price volatility.
Disclosure: I am part of Trade Nation's Influencer program and receive a monthly fee for using their TradingView charts in my analysis.
———————————
WISH YOU ALL LUCK

EURNZD: Short Trading Opportunity
EURNZD
- Classic bearish setup
- Our team expects bearish continuation
SUGGESTED TRADE:
Swing Trade
Short EURNZD
Entry Point - 1.9088
Stop Loss - 1.9138
Take Profit - 1.8982
Our Risk - 1%
Start protection of your profits from lower levels
Disclosure: I am part of Trade Nation's Influencer program and receive a monthly fee for using their TradingView charts in my analysis.
❤️ Please, support our work with like & comment! ❤️

NZDUSD: Market of Sellers
The analysis of the NZDUSD chart clearly shows us that the pair is finally about to tank due to the rising pressure from the sellers.
Disclosure: I am part of Trade Nation's Influencer program and receive a monthly fee for using their TradingView charts in my analysis.
❤️ Please, support our work with like & comment! ❤️

AUDCAD: Will Start Falling! Here is Why:
Looking at the chart of AUDCAD right now we are seeing some interesting price action on the lower timeframes. Thus a local move down seems to be quite likely.
Disclosure: I am part of Trade Nation's Influencer program and receive a monthly fee for using their TradingView charts in my analysis.
❤️ Please, support our work with like & comment! ❤️

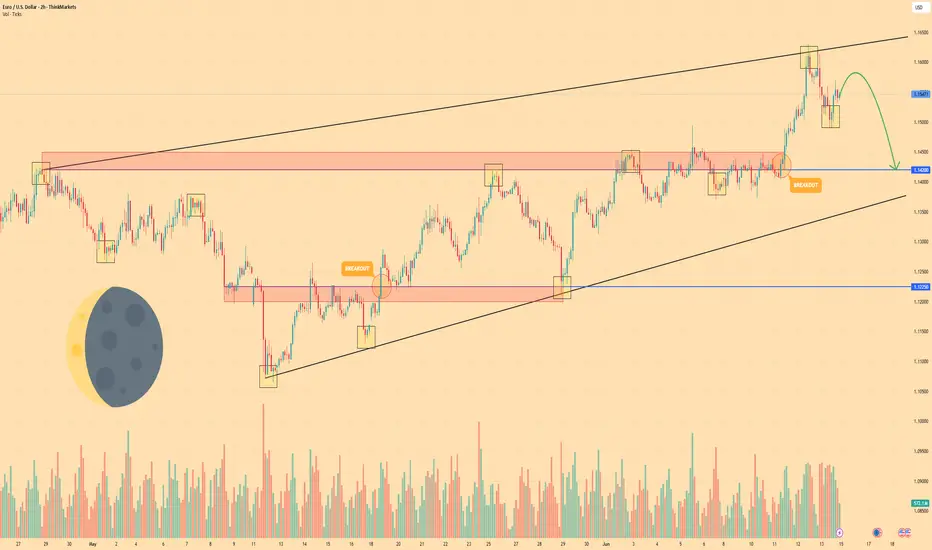
EURO - Pirce can make movement up and then drop to $1.1420Hi guys, this is my overview for EURUSD, feel free to check it and write your feedback in comments👊
After entering the wedge, Euro began to slow down, creating a tightening structure between support and resistance.
Price corrected toward the support line of the wedge, where it briefly paused and bounced with weak momentum.
The bounce triggered a breakout above local resistance, but buyers failed to hold the price at higher levels.
Soon after, the market reversed from the wedge’s upper boundary and began forming a bearish rejection pattern.
Now price trades just below the recent highs, showing fading demand and early signs of short-term reversal.
I expect Euro to move lower and reach the $1.1420 support level — my current target in this scenario.
If this post is useful to you, you can support me with like/boost and advice in comments❤️
Disclaimer: As part of ThinkMarkets’ Influencer Program, I am sponsored to share and publish their charts in my analysis.
NZDCAD Is Going Down! Sell!
Take a look at our analysis for NZDCAD.
Time Frame: 1h
Current Trend: Bearish
Sentiment: Overbought (based on 7-period RSI)
Forecast: Bearish
The market is testing a major horizontal structure 0.825.
Taking into consideration the structure & trend analysis, I believe that the market will reach 0.822 level soon.
P.S
Overbought describes a period of time where there has been a significant and consistent upward move in price over a period of time without much pullback.
Disclosure: I am part of Trade Nation's Influencer program and receive a monthly fee for using their TradingView charts in my analysis.
Like and subscribe and comment my ideas if you enjoy them!

AUDUSD Will Fall! Short!
Take a look at our analysis for AUDUSD.
Time Frame: 3h
Current Trend: Bearish
Sentiment: Overbought (based on 7-period RSI)
Forecast: Bearish
The market is on a crucial zone of supply 0.650.
The above-mentioned technicals clearly indicate the dominance of sellers on the market. I recommend shorting the instrument, aiming at 0.647 level.
P.S
We determine oversold/overbought condition with RSI indicator.
When it drops below 30 - the market is considered to be oversold.
When it bounces above 70 - the market is considered to be overbought.
Disclosure: I am part of Trade Nation's Influencer program and receive a monthly fee for using their TradingView charts in my analysis.
Like and subscribe and comment my ideas if you enjoy them!

AUD/CHF SENDS CLEAR BEARISH SIGNALS|SHORT
AUD/CHF SIGNAL
Trade Direction: short
Entry Level: 0.528
Target Level: 0.525
Stop Loss: 0.530
RISK PROFILE
Risk level: medium
Suggested risk: 1%
Timeframe: 1h
Disclosure: I am part of Trade Nation's Influencer program and receive a monthly fee for using their TradingView charts in my analysis.
✅LIKE AND COMMENT MY IDEAS✅

NZD/CHF BEARS ARE GAINING STRENGTH|SHORT
Hello, Friends!
It makes sense for us to go short on NZD/CHF right now from the resistance line above with the target of 0.487 because of the confluence of the two strong factors which are the general downtrend on the previous 1W candle and the overbought situation on the lower TF determined by it’s proximity to the upper BB band.
Disclosure: I am part of Trade Nation's Influencer program and receive a monthly fee for using their TradingView charts in my analysis.
✅LIKE AND COMMENT MY IDEAS✅

AUD/NZD SELLERS WILL DOMINATE THE MARKET|SHORT
Hello, Friends!
Bearish trend on AUD/NZD, defined by the red colour of the last week candle combined with the fact the pair is overbought based on the BB upper band proximity, makes me expect a bearish rebound from the resistance line above and a retest of the local target below at 1.074.
Disclosure: I am part of Trade Nation's Influencer program and receive a monthly fee for using their TradingView charts in my analysis.
✅LIKE AND COMMENT MY IDEAS✅

NZD/USD BEARS ARE STRONG HERE|SHORT
NZD/USD SIGNAL
Trade Direction: short
Entry Level: 0.605
Target Level: 0.602
Stop Loss: 0.606
RISK PROFILE
Risk level: medium
Suggested risk: 1%
Timeframe: 1h
Disclosure: I am part of Trade Nation's Influencer program and receive a monthly fee for using their TradingView charts in my analysis.
✅LIKE AND COMMENT MY IDEAS✅

USD/JPY SELLERS WILL DOMINATE THE MARKET|SHORT
Hello, Friends!
USD-JPY uptrend evident from the last 1W green candle makes short trades more risky, but the current set-up targeting 144.203 area still presents a good opportunity for us to sell the pair because the resistance line is nearby and the BB upper band is close which indicates the overbought state of the USD/JPY pair.
Disclosure: I am part of Trade Nation's Influencer program and receive a monthly fee for using their TradingView charts in my analysis.
✅LIKE AND COMMENT MY IDEAS✅

USD/CHF BEARS ARE GAINING STRENGTH|SHORT
USD/CHF SIGNAL
Trade Direction: short
Entry Level: 0.821
Target Level: 0.815
Stop Loss: 0.826
RISK PROFILE
Risk level: medium
Suggested risk: 1%
Timeframe: 9h
Disclosure: I am part of Trade Nation's Influencer program and receive a monthly fee for using their TradingView charts in my analysis.
✅LIKE AND COMMENT MY IDEAS✅

Dow Jones Breakout and Potential RetraceHey Traders, in the coming week we are monitoring US30 for a selling opportunity around 42,400 zone, Dow Jones was trading in an uptrend and successfully managed to break it out. Currently is in a corerction phase in which it is approaching the retrace area at 42,400 support and resistance area.
Trade safe, Joe.

SILVER Buyers In Panic! SELL!
My dear friends,
My technical analysis for SILVER is below:
The market is trading on 36.320 pivot level.
Bias - Bearish
Technical Indicators: Both Super Trend & Pivot HL indicate a highly probable Bearish continuation.
Target - 35.168
Recommended Stop Loss - 36.830
About Used Indicators:
A pivot point is a technical analysis indicator, or calculations, used to determine the overall trend of the market over different time frames.
Disclosure: I am part of Trade Nation's Influencer program and receive a monthly fee for using their TradingView charts in my analysis.
———————————
WISH YOU ALL LUCK

EURUSD: Bearish Continuation is Highly Probable! Here is Why:
Remember that we can not, and should not impose our will on the market but rather listen to its whims and make profit by following it. And thus shall be done today on the EURUSD pair which is likely to be pushed down by the bears so we will sell!
Disclosure: I am part of Trade Nation's Influencer program and receive a monthly fee for using their TradingView charts in my analysis.
❤️ Please, support our work with like & comment! ❤️

NATGAS: Market of Sellers
Balance of buyers and sellers on the NATGAS pair, that is best felt when all the timeframes are analyzed properly is shifting in favor of the sellers, therefore is it only natural that we go short on the pair.
Disclosure: I am part of Trade Nation's Influencer program and receive a monthly fee for using their TradingView charts in my analysis.
❤️ Please, support our work with like & comment! ❤️

US500 Will Fall! Short!
Here is our detailed technical review for US500.
Time Frame: 10h
Current Trend: Bearish
Sentiment: Overbought (based on 7-period RSI)
Forecast: Bearish
The market is approaching a significant resistance area 5,979.56.
Due to the fact that we see a positive bearish reaction from the underlined area, I strongly believe that sellers will manage to push the price all the way down to 5,838.14 level.
P.S
Overbought describes a period of time where there has been a significant and consistent upward move in price over a period of time without much pullback.
Disclosure: I am part of Trade Nation's Influencer program and receive a monthly fee for using their TradingView charts in my analysis.
Like and subscribe and comment my ideas if you enjoy them!

AUDJPY Will Go Lower From Resistance! Sell!
Take a look at our analysis for AUDJPY.
Time Frame: 30m
Current Trend: Bearish
Sentiment: Overbought (based on 7-period RSI)
Forecast: Bearish
The market is on a crucial zone of supply 93.507.
The above-mentioned technicals clearly indicate the dominance of sellers on the market. I recommend shorting the instrument, aiming at 93.232 level.
P.S
Please, note that an oversold/overbought condition can last for a long time, and therefore being oversold/overbought doesn't mean a price rally will come soon, or at all.
Disclosure: I am part of Trade Nation's Influencer program and receive a monthly fee for using their TradingView charts in my analysis.
Like and subscribe and comment my ideas if you enjoy them!
