GBPUSD Is Very Bearish! Short!
Please, check our technical outlook for GBPUSD.
Time Frame: 3h
Current Trend: Bearish
Sentiment: Overbought (based on 7-period RSI)
Forecast: Bearish
The price is testing a key resistance 1.355.
Taking into consideration the current market trend & overbought RSI, chances will be high to see a bearish movement to the downside at least to 1.350 level.
P.S
Overbought describes a period of time where there has been a significant and consistent upward move in price over a period of time without much pullback.
Disclosure: I am part of Trade Nation's Influencer program and receive a monthly fee for using their TradingView charts in my analysis.
Like and subscribe and comment my ideas if you enjoy them!
Short

GBPUSD Will Go Down! Short!
Take a look at our analysis for GBPUSD.
Time Frame: 9h
Current Trend: Bearish
Sentiment: Overbought (based on 7-period RSI)
Forecast: Bearish
The market is approaching a key horizontal level 1.356.
Considering the today's price action, probabilities will be high to see a movement to 1.346.
P.S
We determine oversold/overbought condition with RSI indicator.
When it drops below 30 - the market is considered to be oversold.
When it bounces above 70 - the market is considered to be overbought.
Disclosure: I am part of Trade Nation's Influencer program and receive a monthly fee for using their TradingView charts in my analysis.
Like and subscribe and comment my ideas if you enjoy them!

EURUSD: Breakout and Potential RetraceHey Traders, in today's trading session we are monitoring EURUSD for a selling opportunity around 1.14200 zone, EURUSD was trading in an uptrend and successfully managed to break it out. Currently is in a correction phase in which it is approaching the retrace area at 1.14200 support and resistance zone.
Trade safe, Joe.


EURUSD: Short Trade Explained
EURUSD
- Classic bearish pattern
- Our team expects retracement
SUGGESTED TRADE:
Swing Trade
Sell EURUSD
Entry - 1.1398
Stop - 1.1449
Take - 1.1303
Our Risk - 1%
Start protection of your profits from lower levels
Disclosure: I am part of Trade Nation's Influencer program and receive a monthly fee for using their TradingView charts in my analysis.
❤️ Please, support our work with like & comment! ❤️

EURCHF Buyers In Panic! SELL!
My dear friends,
My technical analysis for EURCHF is below:
The market is trading on 0.9383 pivot level.
Bias - Bearish
Technical Indicators: Both Super Trend & Pivot HL indicate a highly probable Bearish continuation.
Target - 0.9351
Recommended Stop Loss - 0.9398
About Used Indicators:
A pivot point is a technical analysis indicator, or calculations, used to determine the overall trend of the market over different time frames.
Disclosure: I am part of Trade Nation's Influencer program and receive a monthly fee for using their TradingView charts in my analysis.
———————————
WISH YOU ALL LUCK

NZDUSD Massive Short! SELL!
My dear friends,
Please, find my technical outlook for NZDUSD below:
The instrument tests an important psychological level 0.6040
Bias - Bearish
Technical Indicators: Supper Trend gives a precise Bearish signal, while Pivot Point HL predicts price changes and potential reversals in the market.
Target - 0.5991
Recommended Stop Loss - 0.6069
About Used Indicators:
Super-trend indicator is more useful in trending markets where there are clear uptrends and downtrends in price.
Disclosure: I am part of Trade Nation's Influencer program and receive a monthly fee for using their TradingView charts in my analysis.
———————————
WISH YOU ALL LUCK

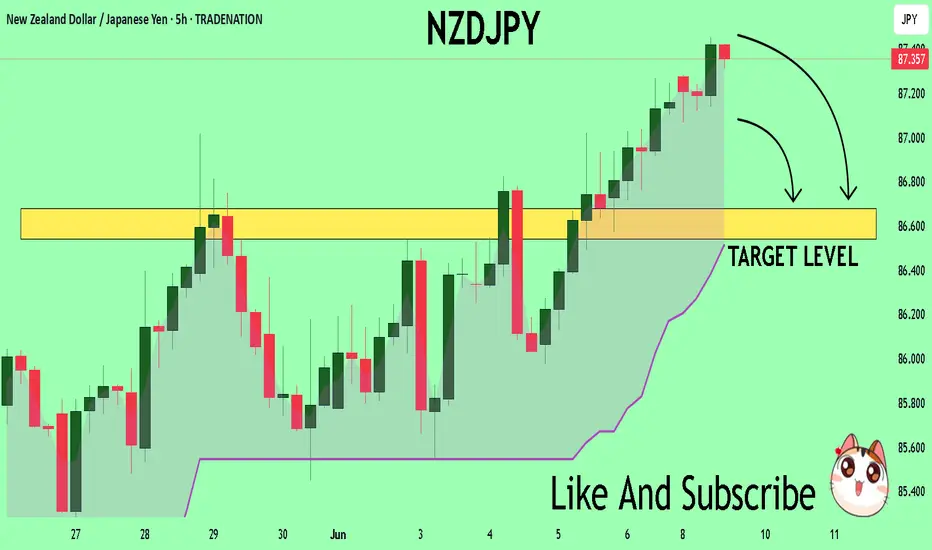
NZDJPY Under Pressure! SELL!
My dear followers,
This is my opinion on the NZDJPY next move:
The asset is approaching an important pivot point 87.365
Bias - Bearish
Technical Indicators: Supper Trend generates a clear short signal while Pivot Point HL is currently determining the overall Bearish trend of the market.
Goal - 86.678
About Used Indicators:
For more efficient signals, super-trend is used in combination with other indicators like Pivot Points.
Disclosure: I am part of Trade Nation's Influencer program and receive a monthly fee for using their TradingView charts in my analysis.
———————————
WISH YOU ALL LUCK
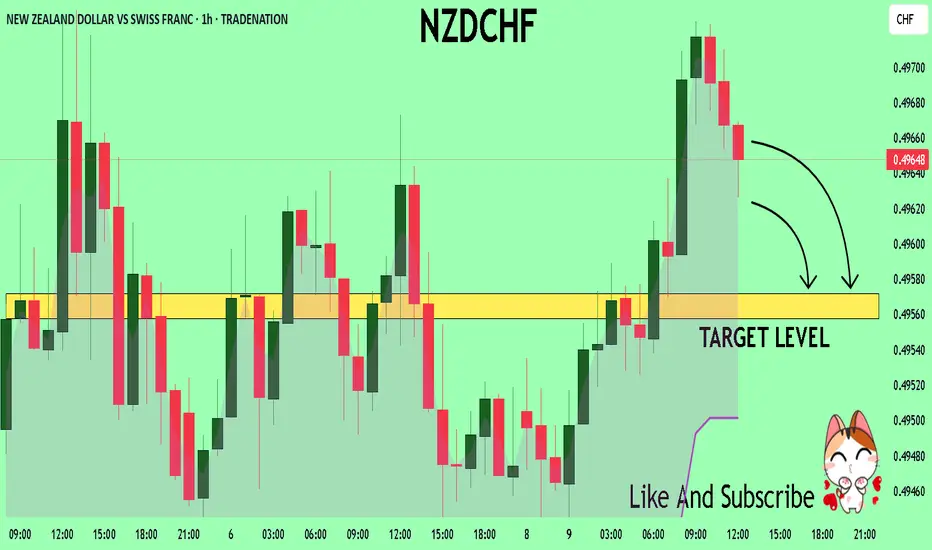
NZDCHF Technical Analysis! SELL!
My dear friends,
Please, find my technical outlook for NZDCHF below:
The instrument tests an important psychological level 0.4965
Bias - Bearish
Technical Indicators: Supper Trend gives a precise Bearish signal, while Pivot Point HL predicts price changes and potential reversals in the market.
Target - 0.4957
About Used Indicators:
Super-trend indicator is more useful in trending markets where there are clear uptrends and downtrends in price.
Disclosure: I am part of Trade Nation's Influencer program and receive a monthly fee for using their TradingView charts in my analysis.
———————————
WISH YOU ALL LUCK
GOLD A Fall Expected! SELL!
My dear subscribers,
My technical analysis for GOLD is below:
The price is coiling around a solid key level - 3321.1
Bias - Bearish
Technical Indicators: Pivot Points High anticipates a potential price reversal.
Super trend shows a clear sell, giving a perfect indicators' convergence.
Goal - 3310.6
My Stop Loss - 3326.3
About Used Indicators:
By the very nature of the supertrend indicator, it offers firm support and resistance levels for traders to enter and exit trades. Additionally, it also provides signals for setting stop losses
Disclosure: I am part of Trade Nation's Influencer program and receive a monthly fee for using their TradingView charts in my analysis.
———————————
WISH YOU ALL LUCK

USOIL Will Go Down From Resistance! Sell!
Here is our detailed technical review for USOIL.
Time Frame: 6h
Current Trend: Bearish
Sentiment: Overbought (based on 7-period RSI)
Forecast: Bearish
The market is trading around a solid horizontal structure 64.869.
The above observations make me that the market will inevitably achieve 63.448 level.
P.S
Please, note that an oversold/overbought condition can last for a long time, and therefore being oversold/overbought doesn't mean a price rally will come soon, or at all.
Disclosure: I am part of Trade Nation's Influencer program and receive a monthly fee for using their TradingView charts in my analysis.
Like and subscribe and comment my ideas if you enjoy them!

GBPJPY Will Move Lower! Sell!
Here is our detailed technical review for GBPJPY.
Time Frame: 15h
Current Trend: Bearish
Sentiment: Overbought (based on 7-period RSI)
Forecast: Bearish
The market is approaching a significant resistance area 195.681.
Due to the fact that we see a positive bearish reaction from the underlined area, I strongly believe that sellers will manage to push the price all the way down to 193.757 level.
P.S
Overbought describes a period of time where there has been a significant and consistent upward move in price over a period of time without much pullback.
Disclosure: I am part of Trade Nation's Influencer program and receive a monthly fee for using their TradingView charts in my analysis.
Like and subscribe and comment my ideas if you enjoy them!

GOLD SENDS CLEAR BEARISH SIGNALS|SHORT
GOLD SIGNAL
Trade Direction: short
Entry Level: 3,316.87
Target Level: 3,146.82
Stop Loss: 3,431.23
RISK PROFILE
Risk level: medium
Suggested risk: 1%
Timeframe: 1D
Disclosure: I am part of Trade Nation's Influencer program and receive a monthly fee for using their TradingView charts in my analysis.
✅LIKE AND COMMENT MY IDEAS✅

AUD/CHF BEARS ARE GAINING STRENGTH|SHORT
AUD/CHF SIGNAL
Trade Direction: short
Entry Level: 0.535
Target Level: 0.531
Stop Loss: 0.538
RISK PROFILE
Risk level: medium
Suggested risk: 1%
Timeframe: 6h
Disclosure: I am part of Trade Nation's Influencer program and receive a monthly fee for using their TradingView charts in my analysis.
✅LIKE AND COMMENT MY IDEAS✅

NZD/CHF SELLERS WILL DOMINATE THE MARKET|SHORT
Hello, Friends!
We are now examining the NZD/CHF pair and we can see that the pair is going up locally while also being in a uptrend on the 1W TF. But there is also a powerful signal from the BB upper band being nearby, indicating that the pair is overbought so we can go short from the resistance line above and a target at 0.493 level.
Disclosure: I am part of Trade Nation's Influencer program and receive a monthly fee for using their TradingView charts in my analysis.
✅LIKE AND COMMENT MY IDEAS✅

CAD/CHF BEARISH BIAS RIGHT NOW| SHORT
Hello, Friends!
The BB upper band is nearby so CAD/CHF is in the overbought territory. Thus, despite the uptrend on the 1W timeframe I think that we will see a bearish reaction from the resistance line above and a move down towards the target at around 0.593.
Disclosure: I am part of Trade Nation's Influencer program and receive a monthly fee for using their TradingView charts in my analysis.
✅LIKE AND COMMENT MY IDEAS✅

Dollar - Still going for TargetAs mentioned in the video on Friday 2 min before NFP. We could run higher on the dollar and i didnt want it to take out the 4 hour candle as shown here.
Go back and see the video for reference. Link below
We should head towards the Target now and im still bearish dollar. Very Bearish

NASDAQ 100 Long up to 22,000 then shortLooking for the short around 22,000-22,1000 region. Only valid on bearish PA confirmation. Looking for that 1,500+ point downside move. Some target in between.

Gold Market Analysis: Short-Term Weakness, Long-Term OptimismAfter a significant drop on Friday, gold prices hit a low of **$3316** in the US market, indicating that the current market correction is likely to continue into next week.
### Current Market Dynamics
The short-term outlook for gold appears weaker, with the 4-hour cycle showing a decline and the daily cycle facing upward pressure. Despite this, the overall market remains within a broad trading range, mirroring the patterns observed in May.
The recent fall below the **$3330** support level is a key indicator. This point acted as a pivot between bullish and bearish sentiment, and its breach suggests that the short-term market has entered a period of weakness and volatility. However, the market hasn't fully shifted into a bearish trend. We can expect a continued downward fluctuation, but the extent of this drop should be limited, making a sharp decline unlikely.
### Trading Strategy for the Coming Week
Given these dynamics, a "short-term selling and long-term buying" strategy is recommended.
* **Short-term operations** may involve selling, but this should be approached cautiously.
* From a broader perspective, **buying remains the primary strategy**.
Looking ahead to next week, we anticipate the market will fluctuate and find a bottom around **$3300**. Once this support level stabilizes, a new upward trend is expected to begin.
**Key price levels to watch:**
* **Short-term resistance:** $3340
* **Lower support:** $3300
Flexibility in your trading arrangements will be crucial to capitalize on upcoming market opportunities.

NATGAS: Bearish Continuation & Short Trade
NATGAS
- Classic bearish formation
- Our team expects fall
SUGGESTED TRADE:
Swing Trade
Sell NATGAS
Entry Level - 3.785
Sl - 3.918
Tp - 3.532
Our Risk - 1%
Start protection of your profits from lower levels
Disclosure: I am part of Trade Nation's Influencer program and receive a monthly fee for using their TradingView charts in my analysis.
❤️ Please, support our work with like & comment! ❤️

SILVER: Short Signal with Entry/SL/TP
SILVER
- Classic bearish formation
- Our team expects pullback
SUGGESTED TRADE:
Swing Trade
Short SILVER
Entry - 35.980
Sl - 36.467
Tp - 34.940
Our Risk - 1%
Start protection of your profits from lower levels
Disclosure: I am part of Trade Nation's Influencer program and receive a monthly fee for using their TradingView charts in my analysis.
❤️ Please, support our work with like & comment! ❤️

SPY Trading Opportunity! SELL!
My dear followers,
I analysed this chart on SPY and concluded the following:
The market is trading on 599.04 pivot level.
Bias - Bearish
Technical Indicators: Both Super Trend & Pivot HL indicate a highly probable Bearish continuation.
Target - 570.83
Safe Stop Loss - 616.43
About Used Indicators:
A super-trend indicator is plotted on either above or below the closing price to signal a buy or sell. The indicator changes color, based on whether or not you should be buying. If the super-trend indicator moves below the closing price, the indicator turns green, and it signals an entry point or points to buy.
Disclosure: I am part of Trade Nation's Influencer program and receive a monthly fee for using their TradingView charts in my analysis.
———————————
WISH YOU ALL LUCK

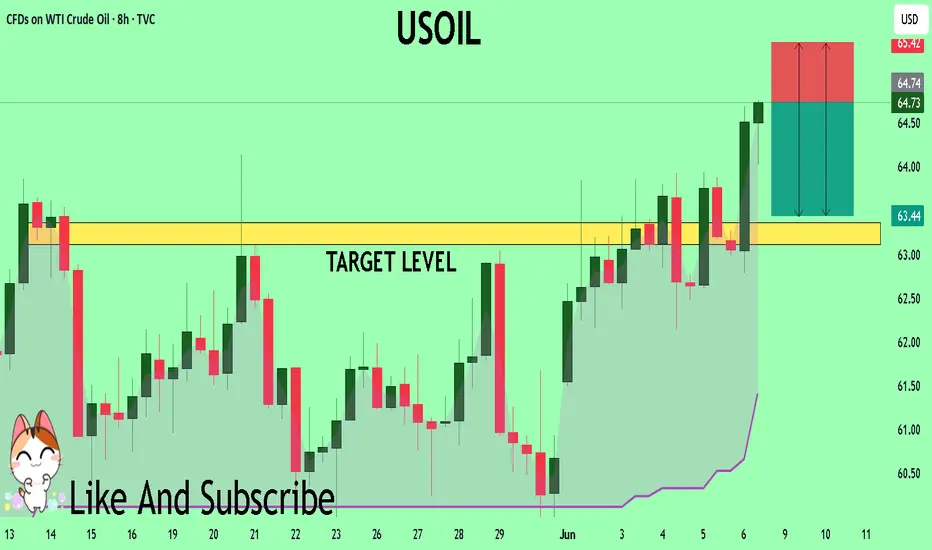
USOIL What Next? SELL!
My dear friends,
USOIL looks like it will make a good move, and here are the details:
The market is trading on 64.73 pivot level.
Bias - Bearish
Technical Indicators: Supper Trend generates a clear short signal while Pivot Point HL is currently determining the overall Bearish trend of the market.
Goal - 63.36
Recommended Stop Loss - 65.42
About Used Indicators:
Pivot points are a great way to identify areas of support and resistance, but they work best when combined with other kinds of technical analysis
Disclosure: I am part of Trade Nation's Influencer program and receive a monthly fee for using their TradingView charts in my analysis.
———————————
WISH YOU ALL LUCK