XAUUAD UPDATE 29 - 05 - 2025This chart is a 30-minute candlestick chart for CFDs on Gold (XAU/USD), published on TradingView. Here’s a detailed breakdown of what it shows:
---
Chart Analysis Details
1. Timeframe:
30-minute candlesticks, showing short-term price movements.
2. Price Levels:
Current price: Around 3,277.014 USD
Resistance zone (highlighted in yellow near the top): Around 3,299.476 USD
Support zone (highlighted in yellow near the bottom): Around 3,249.832 USD
3. Volume:
Volume bars at the bottom suggest increased activity leading up to and during the most recent upward movement.
4. Price Action:
There was a strong bullish move recovering from the support area near 3,250 USD.
Price reached a recent high near 3,285 USD and began to retrace slightly.
5. Forecast/Prediction (Illustrated by blue arrows):
The trader (Mr_Zakrii) anticipates a bearish reversal from the current region.
The blue arrows suggest a short position setup:
Entry near 3,285 USD
Target back toward the support area near 3,250 USD
Stop-loss near 3,299.476 USD
6. Risk-to-Reward Ratio:
The shaded red and green areas represent the stop-loss and take-profit zones respectively, indicating a favorable risk-to-reward setup (reward appears larger than the risk).
7. News Indicator:
There's a news icon (U.S. flag) indicating an upcoming news event that might affect the gold price volatility.
---
Conclusion:
This is a bearish setup based on a resistance rejection around 3,285–3,299 USD, aiming for a move back to the support zone near 3,250 USD. The chart suggests a sell position with a clear stop-loss and take-profit area, possibly relying on technical resistance and recent price action for confirmation.
Let me know if you want help evaluating the trade setup or analyzing the fundamental context behind it.
Short

EUR/GBP BEARS ARE GAINING STRENGTH|SHORT
EUR/GBP SIGNAL
Trade Direction: short
Entry Level: 0.860
Target Level: 0.843
Stop Loss: 0.872
RISK PROFILE
Risk level: medium
Suggested risk: 1%
Timeframe: 1D
Disclosure: I am part of Trade Nation's Influencer program and receive a monthly fee for using their TradingView charts in my analysis.
✅LIKE AND COMMENT MY IDEAS✅

EURO - Price can rise a little and then start to declineHi guys, this is my overview for EURUSD, feel free to check it and write your feedback in comments👊
Some time ago, price entered a falling channel, where it broke through $1.1310 level at once, but soon broke it again.
Price traded near this level for some time, after which it reached resistance line and continued to decline.
Then price broke $1.1310 level and dropped to $1.1065 level, after which it turned around and started to grow within the channel.
In the rising channel, Euro broke $1.1140 level and continued to grow, but later made a correction to this level.
After this, price continued to grow and later broke $1.1310 level, then rose to the resistance line of the channel.
I expect that Euro will rise to resistance line and then start to decline to the $1.1310 support level.
If this post is useful to you, you can support me with like/boost and advice in comments❤️
Disclaimer: As part of ThinkMarkets’ Influencer Program, I am sponsored to share and publish their charts in my analysis.

EURUSD: Bearish Continuation & Short Trade
EURUSD
- Classic bearish formation
- Our team expects fall
SUGGESTED TRADE:
Swing Trade
Sell EURUSD
Entry Level - 1.1312
Sl - 1.1356
Tp - 1.1223
Our Risk - 1%
Start protection of your profits from lower levels
Disclosure: I am part of Trade Nation's Influencer program and receive a monthly fee for using their TradingView charts in my analysis.
❤️ Please, support our work with like & comment! ❤️

NZDUSD What Next? SELL!
My dear friends,
My technical analysis for NZDUSD is below:
The market is trading on 0.5966 pivot level.
Bias - Bearish
Technical Indicators: Both Super Trend & Pivot HL indicate a highly probable Bearish continuation.
Target - 0.5933
Recommended Stop Loss - 0.5989
About Used Indicators:
A pivot point is a technical analysis indicator, or calculations, used to determine the overall trend of the market over different time frames.
Disclosure: I am part of Trade Nation's Influencer program and receive a monthly fee for using their TradingView charts in my analysis.
———————————
WISH YOU ALL LUCK

GBPJPY: Short Signal with Entry/SL/TP
GBPJPY
- Classic bearish formation
- Our team expects pullback
SUGGESTED TRADE:
Swing Trade
Short GBPJPY
Entry - 194.65
Sl - 195.26
Tp - 193.50
Our Risk - 1%
Start protection of your profits from lower levels
Disclosure: I am part of Trade Nation's Influencer program and receive a monthly fee for using their TradingView charts in my analysis.
❤️ Please, support our work with like & comment! ❤️

GBPCAD: Bearish Continuation is Expected! Here is Why:
Looking at the chart of GBPCAD right now we are seeing some interesting price action on the lower timeframes. Thus a local move down seems to be quite likely.
Disclosure: I am part of Trade Nation's Influencer program and receive a monthly fee for using their TradingView charts in my analysis.
❤️ Please, support our work with like & comment! ❤️

EURGBP: Bears Will Push
Remember that we can not, and should not impose our will on the market but rather listen to its whims and make profit by following it. And thus shall be done today on the EURGBP pair which is likely to be pushed down by the bears so we will sell!
Disclosure: I am part of Trade Nation's Influencer program and receive a monthly fee for using their TradingView charts in my analysis.
❤️ Please, support our work with like & comment! ❤️

USDCHF Will Move Lower! Sell!
Take a look at our analysis for USDCHF.
Time Frame: 6h
Current Trend: Bearish
Sentiment: Overbought (based on 7-period RSI)
Forecast: Bearish
The market is on a crucial zone of supply 0.826.
The above-mentioned technicals clearly indicate the dominance of sellers on the market. I recommend shorting the instrument, aiming at 0.814 level.
P.S
Overbought describes a period of time where there has been a significant and consistent upward move in price over a period of time without much pullback.
Disclosure: I am part of Trade Nation's Influencer program and receive a monthly fee for using their TradingView charts in my analysis.
Like and subscribe and comment my ideas if you enjoy them!

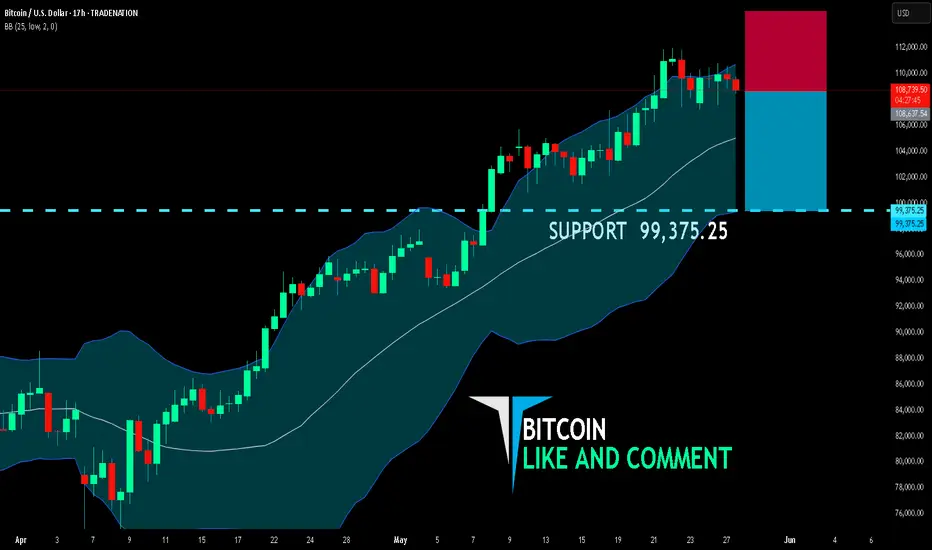
BITCOIN SELLERS WILL DOMINATE THE MARKET|SHORT
BITCOIN SIGNAL
Trade Direction: short
Entry Level: 108,637.54
Target Level: 99,375.25
Stop Loss: 114,788.84
RISK PROFILE
Risk level: medium
Suggested risk: 1%
Timeframe: 17h
Disclosure: I am part of Trade Nation's Influencer program and receive a monthly fee for using their TradingView charts in my analysis.
✅LIKE AND COMMENT MY IDEAS✅
USD/JPY BEARISH BIAS RIGHT NOW| SHORT
USD/JPY SIGNAL
Trade Direction: short
Entry Level: 144.107
Target Level: 141.877
Stop Loss: 145.579
RISK PROFILE
Risk level: medium
Suggested risk: 1%
Timeframe: 6h
Disclosure: I am part of Trade Nation's Influencer program and receive a monthly fee for using their TradingView charts in my analysis.
✅LIKE AND COMMENT MY IDEAS✅

GBP/USD BEST PLACE TO SELL FROM|SHORT
Hello, Friends!
The BB upper band is nearby so GBP-USD is in the overbought territory. Thus, despite the uptrend on the 1W timeframe I think that we will see a bearish reaction from the resistance line above and a move down towards the target at around 1.334.
Disclosure: I am part of Trade Nation's Influencer program and receive a monthly fee for using their TradingView charts in my analysis.
✅LIKE AND COMMENT MY IDEAS✅

EUR/USD BEARS ARE STRONG HERE|SHORT
Hello, Friends!
Bearish trend on EUR/USD, defined by the red colour of the last week candle combined with the fact the pair is overbought based on the BB upper band proximity, makes me expect a bearish rebound from the resistance line above and a retest of the local target below at 1.104.
Disclosure: I am part of Trade Nation's Influencer program and receive a monthly fee for using their TradingView charts in my analysis.
✅LIKE AND COMMENT MY IDEAS✅

GBPUSD SHORT FORECAST Q2 W22 D28 Y25GBPUSD SHORT FORECAST Q2 W22 D28 Y25
🔥👀QUICK SCOPE TECHNICAL REVERSAL HOT PICK
Professional Risk Managers👋
Welcome back to another FRGNT chart update📈
Diving into some Forex setups using predominantly higher time frame order blocks alongside confirmation breaks of structure.
Let’s see what price action is telling us today!
💡Here are some trade confluences📝
✅Weekly order block
✅15' order block
✅Intraday bearish breaks of structure
✅Tokyo ranges to be filled
🔑 Remember, to participate in trading comes always with a degree of risk, therefore as professional risk managers it remains vital that we stick to our risk management plan as well as our trading strategies.
📈The rest, we leave to the balance of probabilities.
💡Fail to plan. Plan to fail.
🏆It has always been that simple.
❤️Good luck with your trading journey, I shall see you at the very top.
🎯Trade consistent, FRGNT X

CHFJPY Will Collapse! SELL!
My dear subscribers,
My technical analysis for CHFJPY is below:
The price is coiling around a solid key level - 174.11
Bias - Bearish
Technical Indicators: Pivot Points Low anticipates a potential price reversal.
Super trend shows a clear sell, giving a perfect indicators' convergence.
Goal - 173.84
About Used Indicators:
By the very nature of the supertrend indicator, it offers firm support and resistance levels for traders to enter and exit trades. Additionally, it also provides signals for setting stop losses
Disclosure: I am part of Trade Nation's Influencer program and receive a monthly fee for using their TradingView charts in my analysis.
———————————
WISH YOU ALL LUCK

GBPUSD Will Fall! Short!
Please, check our technical outlook for GBPUSD.
Time Frame: 12h
Current Trend: Bearish
Sentiment: Overbought (based on 7-period RSI)
Forecast: Bearish
The market is approaching a key horizontal level 1.355.
Considering the today's price action, probabilities will be high to see a movement to 1.336.
P.S
Overbought describes a period of time where there has been a significant and consistent upward move in price over a period of time without much pullback.
Disclosure: I am part of Trade Nation's Influencer program and receive a monthly fee for using their TradingView charts in my analysis.
Like and subscribe and comment my ideas if you enjoy them!

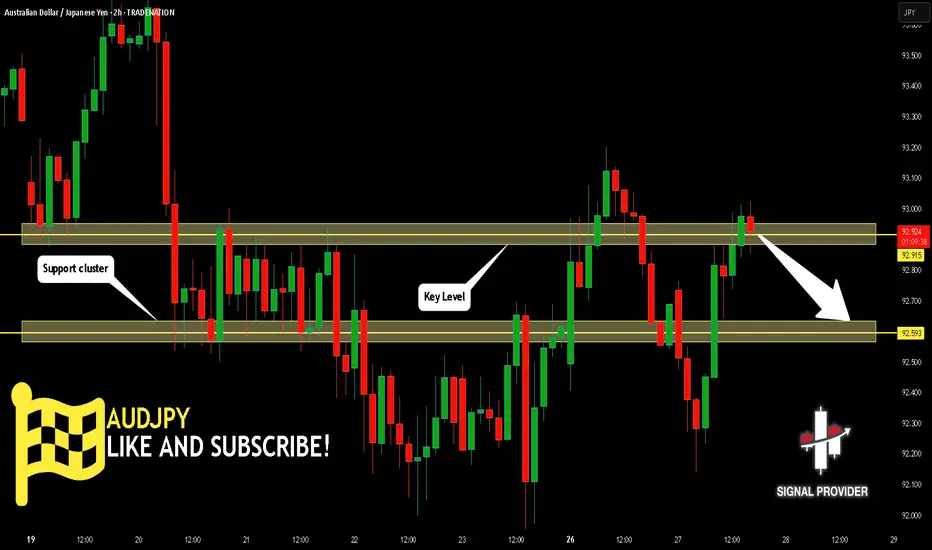
AUDJPY Will Go Lower From Resistance! Short!
Here is our detailed technical review for AUDJPY.
Time Frame: 2h
Current Trend: Bearish
Sentiment: Overbought (based on 7-period RSI)
Forecast: Bearish
The market is approaching a significant resistance area 92.915.
Due to the fact that we see a positive bearish reaction from the underlined area, I strongly believe that sellers will manage to push the price all the way down to 92.593 level.
P.S
Please, note that an oversold/overbought condition can last for a long time, and therefore being oversold/overbought doesn't mean a price rally will come soon, or at all.
Disclosure: I am part of Trade Nation's Influencer program and receive a monthly fee for using their TradingView charts in my analysis.
Like and subscribe and comment my ideas if you enjoy them!
EURJPY: Bearish Continuation
Balance of buyers and sellers on the EURJPY pair, that is best felt when all the timeframes are analyzed properly is shifting in favor of the sellers, therefore is it only natural that we go short on the pair.
Disclosure: I am part of Trade Nation's Influencer program and receive a monthly fee for using their TradingView charts in my analysis.
❤️ Please, support our work with like & comment! ❤️

GOLD Will Go Down! Sell!
Please, check our technical outlook for GOLD.
Time Frame: 2h
Current Trend: Bearish
Sentiment: Overbought (based on 7-period RSI)
Forecast: Bearish
The market is approaching a key horizontal level 3,354.87.
Considering the today's price action, probabilities will be high to see a movement to 3,290.54.
P.S
Overbought describes a period of time where there has been a significant and consistent upward move in price over a period of time without much pullback.
Disclosure: I am part of Trade Nation's Influencer program and receive a monthly fee for using their TradingView charts in my analysis.
Like and subscribe and comment my ideas if you enjoy them!

USDJPY Is Bearish! Short!
Take a look at our analysis for USDJPY.
Time Frame: 30m
Current Trend: Bearish
Sentiment: Overbought (based on 7-period RSI)
Forecast: Bearish
The market is testing a major horizontal structure 142.838.
Taking into consideration the structure & trend analysis, I believe that the market will reach 142.464 level soon.
P.S
Please, note that an oversold/overbought condition can last for a long time, and therefore being oversold/overbought doesn't mean a price rally will come soon, or at all.
Disclosure: I am part of Trade Nation's Influencer program and receive a monthly fee for using their TradingView charts in my analysis.
Like and subscribe and comment my ideas if you enjoy them!

AUDJPY: Bearish Continuation is Highly Probable! Here is Why:
The charts are full of distraction, disturbance and are a graveyard of fear and greed which shall not cloud our judgement on the current state of affairs in the AUDJPY pair price action which suggests a high likelihood of a coming move down.
Disclosure: I am part of Trade Nation's Influencer program and receive a monthly fee for using their TradingView charts in my analysis.
❤️ Please, support our work with like & comment! ❤️

SILVER SHORT FROM RESISTANCE
SILVER SIGNAL
Trade Direction: short
Entry Level: 3,288.2
Target Level: 3,157.4
Stop Loss: 3,374.6
RISK PROFILE
Risk level: medium
Suggested risk: 1%
Timeframe: 12h
Disclosure: I am part of Trade Nation's Influencer program and receive a monthly fee for using their TradingView charts in my analysis.
✅LIKE AND COMMENT MY IDEAS✅

NZD/CHF BEARS WILL DOMINATE THE MARKET|SHORT
NZD/CHF SIGNAL
Trade Direction: short
Entry Level: 0.492
Target Level: 0.486
Stop Loss: 0.495
RISK PROFILE
Risk level: medium
Suggested risk: 1%
Timeframe: 8h
Disclosure: I am part of Trade Nation's Influencer program and receive a monthly fee for using their TradingView charts in my analysis.
✅LIKE AND COMMENT MY IDEAS✅
