AUD/JPY BEARS ARE STRONG HERE|SHORT
Hello, Friends!
We are targeting the 92.544 level area with our short trade on AUD/JPY which is based on the fact that the pair is overbought on the BB band scale and is also approaching a resistance line above thus going us a good entry option.
Disclosure: I am part of Trade Nation's Influencer program and receive a monthly fee for using their TradingView charts in my analysis.
✅LIKE AND COMMENT MY IDEAS✅
Short

CAD/JPY BEST PLACE TO SELL FROM|SHORT
Hello, Friends!
CAD/JPY pair is trading in a local downtrend which know by looking at the previous 1W candle which is red. On the 1H timeframe the pair is going up. The pair is overbought because the price is close to the upper band of the BB indicator. So we are looking to sell the pair with the upper BB line acting as resistance. The next target is 103.758 area.
Disclosure: I am part of Trade Nation's Influencer program and receive a monthly fee for using their TradingView charts in my analysis.
✅LIKE AND COMMENT MY IDEAS✅

CADCHF Set To Fall! SELL!
My dear followers,
This is my opinion on the CADCHF next move:
The asset is approaching an important pivot point 0.6003
Bias - Bearish
Technical Indicators: Supper Trend generates a clear short signal while Pivot Point HL is currently determining the overall Bearish trend of the market.
Goal - 0.5968
About Used Indicators:
For more efficient signals, super-trend is used in combination with other indicators like Pivot Points.
Disclosure: I am part of Trade Nation's Influencer program and receive a monthly fee for using their TradingView charts in my analysis.
———————————
WISH YOU ALL LUCK

GBPNZD Trading Opportunity! SELL!
My dear friends,
Please, find my technical outlook for GBPNZD below:
The instrument tests an important psychological level 2.2738
Bias - Bearish
Technical Indicators: Supper Trend gives a precise Bearish signal, while Pivot Point HL predicts price changes and potential reversals in the market.
Target - 2.2584
Recommended Stop Loss - 2.2812
About Used Indicators:
Super-trend indicator is more useful in trending markets where there are clear uptrends and downtrends in price.
Disclosure: I am part of Trade Nation's Influencer program and receive a monthly fee for using their TradingView charts in my analysis.
———————————
WISH YOU ALL LUCK

SILVER Buyers In Panic! SELL!
My dear friends,
Please, find my technical outlook for SILVER below:
The price is coiling around a solid key level - 33.484
Bias - Bearish
Technical Indicators: Pivot Points Low anticipates a potential price reversal.
Super trend shows a clear sell, giving a perfect indicators' convergence.
Goal - 32.948
Safe Stop Loss - 33.744
About Used Indicators:
The pivot point itself is simply the average of the high, low and closing prices from the previous trading day.
Disclosure: I am part of Trade Nation's Influencer program and receive a monthly fee for using their TradingView charts in my analysis.
———————————
WISH YOU ALL LUCK

GOLD (XAU/USD) : SHORT IDEAThe chart shows a classic bearish pennant formation after a strong downward move. Gold has been consolidating in a tight triangular pattern with converging trend lines, indicating decreased volatility before the next directional move. This technical pattern emerged following a significant decline from the 3,350+ highs, with price action now squeezed between narrowing support and resistance levels.
The pennant structure is textbook - we see the characteristic flag-like consolidation with declining volume and compressed price range after the initial sharp selloff. The upper boundary shows consistent rejection of higher prices, while the lower boundary has provided temporary support. This coiling action typically precedes a continuation of the prior trend, which in this case points to further downside.
From a fundamental perspective, the setup aligns with potential policy shifts that could pressure precious metals. Market expectations around tariff pauses or delays in trade war escalation would likely reduce demand for safe-haven assets like gold. When geopolitical tensions ease or trade uncertainties diminish, investors typically rotate out of defensive positions and back into risk assets. Gold, being a primary safe-haven play, tends to suffer during these periods of reduced fear and uncertainty.
The current consolidation may be reflecting this underlying shift in sentiment - from crisis-driven demand to a more stable economic outlook. If tariff implementations are indeed paused or softened, we could see accelerated outflows from precious metals as investors no longer feel the need for portfolio insurance. This fundamental backdrop supports the technical bearish bias, as both chart patterns and potential policy changes point toward continued weakness in gold prices.
The tight range also suggests that a significant move is imminent, with the technical setup favoring a break to the downside based on both the pattern structure and the evolving macro environment.

GOLD - Price can continue to fall and exit from triangle patternHi guys, this is my overview for GOLD, feel free to check it and write your feedback in comments👊
Some days ago, price entered to rising channel, where it turned around and made a correction to the support line.
Then it continued to grow and rose to the $2975 level, which continued with a support area, and continued to grow.
Later price rose to the resistance line, but then made a correction movement, thereby exiting the channel.
Next, Gold turned around and started to trade inside the triangle, where it at once made an upward impulse.
Price broke $3265 level, rose to resistance line, after which in a short time declined to this level.
But recently it has come back, so I expect that Gold can continue to fall to $3150, breaking the support level.
If this post is useful to you, you can support me with like/boost and advice in comments❤️
Disclaimer: As part of ThinkMarkets’ Influencer Program, I am sponsored to share and publish their charts in my analysis.

HelenP. I Gold may break trend line and continue to fallHi folks today I'm prepared for you Gold analytics. The trend line on this chart has consistently acted as a dynamic support for price, with multiple clean rebounds confirming its strength. As the price continued respecting this diagonal line, the structure gradually began tightening, forming a large symmetrical triangle. This pattern suggests a buildup of pressure between buyers and sellers. Once inside the triangle, the price action turned more volatile, with higher lows pushing against a strong resistance zone around the 3365 - 3390 range. Despite multiple attempts to break through, the market failed to sustain any move above this level. Each rally was met with rejection, and bearish momentum slowly started to emerge. Recently, the price reached the upper boundary of the triangle and touched the resistance zone again, but it quickly pulled back without breaking out. Currently, Gold is trading close to the intersection of the resistance zone and the trend line, where a decisive move is likely to occur. Given the weakening bullish momentum and the triangle’s narrowing formation, I expect the price to exit the pattern to the downside. A break of the trend line may trigger stronger selling, leading to a move toward the 3225 level - my current goal based on this potential bearish breakout. If you like my analytics you may support me with your like/comment ❤️
Disclaimer: As part of ThinkMarkets’ Influencer Program, I am sponsored to share and publish their charts in my analysis.

HelenP. I Bitcoin will start to decline and break trend lineHi folks today I'm prepared for you Bitcoin analytics. Observing this chart, we can see how the price dropped from support 2, which coincided with the support zone and reached the trned line. Then it turned around and started to grow, and soon reached the 83700 support level again and even broke it. Next, price some time traded near this level and after a retest, it turned around and made an impulse up, after which it turned around and then declined to the trend line, after which it rose to support 1, which coincided with one more support zone. Soon, BTC broke the 101400 level and then repeated movement when it traded near the support 2 level. Price, after trading near the 101400 level, rebounded from the trend line and rose to new ARH 112000 points and then went into correction. At the moment, I expect that BTCUSDT will start to decline, break the trend line, and continue to fall to the support zone. That's why I set my goal near this area, at the 102700 points. If you like my analytics you may support me with your like/comment ❤️

EURUSD: Short Signal Explained
EURUSD
- Classic bearish pattern
- Our team expects retracement
SUGGESTED TRADE:
Swing Trade
Sell EURGBP
Entry - 1.1383
Stop - 1.1438
Take - 1.1272
Our Risk - 1%
Start protection of your profits from lower levels
Disclosure: I am part of Trade Nation's Influencer program and receive a monthly fee for using their TradingView charts in my analysis.
❤️ Please, support our work with like & comment! ❤️

GBPCAD: Expecting Bearish Continuation! Here is Why:
The price of GBPCAD will most likely collapse soon enough, due to the supply beginning to exceed demand which we can see by looking at the chart of the pair.
Disclosure: I am part of Trade Nation's Influencer program and receive a monthly fee for using their TradingView charts in my analysis.
❤️ Please, support our work with like & comment! ❤️

NAS100 Will Go Down! Sell!
Please, check our technical outlook for NAS100.
Time Frame: 12h
Current Trend: Bearish
Sentiment: Overbought (based on 7-period RSI)
Forecast: Bearish
The price is testing a key resistance 21,208.3.
Taking into consideration the current market trend & overbought RSI, chances will be high to see a bearish movement to the downside at least to 19,875.4 level.
P.S
We determine oversold/overbought condition with RSI indicator.
When it drops below 30 - the market is considered to be oversold.
When it bounces above 70 - the market is considered to be overbought.
Disclosure: I am part of Trade Nation's Influencer program and receive a monthly fee for using their TradingView charts in my analysis.
Like and subscribe and comment my ideas if you enjoy them!

Daily BTC OverviewThe daily chart in its simplest form can be broken down into this range. Since President Trumps inauguration, BTC has declined from a range high of $108,000 back to the lows of $74,500 closing the FVG caused by the US election rally. After a double bottom Bitcoin mean reverted back to the range midpoint which to me is the most important area on the entire chart because it decides if the bull run can continue or if it dies.
I like to keep a close eye on the 200 EMA on multiple timeframes but the 1D is important to gauge the momentum of the move. As the US election results came in a massive push away from this moving average causes the level to steepen in its climb showing strength. Since BTC spent quite some time in the top half of the range the 1D 200 EMA flattens out signaling a loss of momentum, once this level does become flat it no longer provides support. For a bullish cycle to be just that ideally the corrective moves do not spend too much time below this level before expanding above and beyond it once again starting the next leg of the move. A persistent move down below causes a rollover and the cycle looks to be over with a bear market beginning.
Bullish scenario - The correction is over and BTC consistently posts HH's & HLs bringing the 1D 200 EMA up with price and continues the previous bullish trend. I would want to see the retest of the midpoint be successful and then move to reclaim the next local high before targeting range high. The bull market correction looks to be over and bullish continuation resumes.
Bearish scenario - This move is nothing more than a LH, BTC wicks the supply above midpoint, swing fails back under and continues to make LH's & LL's back down to range low where the 1D 200EMA will have now rolled over providing more of a resistance level. The bear market looks to have begun.
I am not here to make a call on where BTC is going next as I do not have that answer, but I do have to plan for each eventuality and that is what I have done here from a TA pint of view. Now it is entirely possible that Geo-political news or an exchange hack etc throws TA out of the window and I have to rethink the plan but in a strictly chart structure perspective this is how I see it.
The indicator "TRADING ENVIRONMENT+V1.0" used in the Idea post is now publicly available for use, give it a try and leave your thoughts and suggestions on the post, thank you.

USDJPY Will Go Lower From Resistance! Sell!
Please, check our technical outlook for USDJPY.
Time Frame: 12h
Current Trend: Bearish
Sentiment: Overbought (based on 7-period RSI)
Forecast: Bearish
The market is testing a major horizontal structure 145.469.
Taking into consideration the structure & trend analysis, I believe that the market will reach 142.516 level soon.
P.S
The term oversold refers to a condition where an asset has traded lower in price and has the potential for a price bounce.
Overbought refers to market scenarios where the instrument is traded considerably higher than its fair value. Overvaluation is caused by market sentiments when there is positive news.
Disclosure: I am part of Trade Nation's Influencer program and receive a monthly fee for using their TradingView charts in my analysis.
Like and subscribe and comment my ideas if you enjoy them!

GOLD SELLERS WILL DOMINATE THE MARKET|SHORT
GOLD SIGNAL
Trade Direction: short
Entry Level: 3,335.28
Target Level: 3,136.44
Stop Loss: 3,467.43
RISK PROFILE
Risk level: medium
Suggested risk: 1%
Timeframe: 1D
Disclosure: I am part of Trade Nation's Influencer program and receive a monthly fee for using their TradingView charts in my analysis.
✅LIKE AND COMMENT MY IDEAS✅

NZD/JPY BEARISH BIAS RIGHT NOW| SHORT
NZD/JPY SIGNAL
Trade Direction: short
Entry Level: 85.992
Target Level: 83.908
Stop Loss: 87.366
RISK PROFILE
Risk level: medium
Suggested risk: 1%
Timeframe: 1D
Disclosure: I am part of Trade Nation's Influencer program and receive a monthly fee for using their TradingView charts in my analysis.
✅LIKE AND COMMENT MY IDEAS✅

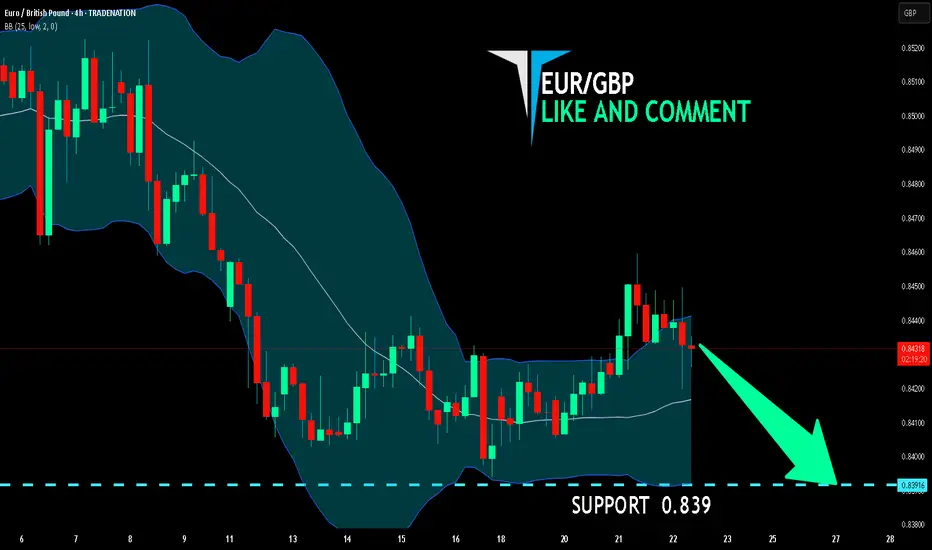
EUR/GBP BEARS ARE GAINING STRENGTH|SHORT
Hello, Friends!
EUR/GBP pair is trading in a local downtrend which know by looking at the previous 1W candle which is red. On the 4H timeframe the pair is going up. The pair is overbought because the price is close to the upper band of the BB indicator. So we are looking to sell the pair with the upper BB line acting as resistance. The next target is 0.839 area.
Disclosure: I am part of Trade Nation's Influencer program and receive a monthly fee for using their TradingView charts in my analysis.
✅LIKE AND COMMENT MY IDEAS✅
SILVER: Short Signal Explained
SILVER
- Classic bearish setup
- Our team expects bearish continuation
SUGGESTED TRADE:
Swing Trade
Short SILVER
Entry Point - 33.484
Stop Loss - 33.753
Take Profit - 32.948
Our Risk - 1%
Start protection of your profits from lower levels
Disclosure: I am part of Trade Nation's Influencer program and receive a monthly fee for using their TradingView charts in my analysis.
❤️ Please, support our work with like & comment! ❤️

TESLA: Short Trade with Entry/SL/TP
TESLA
- Classic bearish formation
- Our team expects fall
SUGGESTED TRADE:
Swing Trade
Sell TESLA
Entry Level - 339.30
Sl -354.47
Tp - 301.39
Our Risk - 1%
Start protection of your profits from lower levels
Disclosure: I am part of Trade Nation's Influencer program and receive a monthly fee for using their TradingView charts in my analysis.
❤️ Please, support our work with like & comment! ❤️

EURUSD The Target Is DOWN! SELL!
My dear subscribers,
This is my opinion on the EURUSD next move:
The instrument tests an important psychological level 1.1363
Bias - Bearish
Technical Indicators: Supper Trend gives a precise Bearish signal, while Pivot Point HL predicts price changes and potential reversals in the market.
Target - 1.1282
My Stop Loss - 1.1405
About Used Indicators:
On the subsequent day, trading above the pivot point is thought to indicate ongoing bullish sentiment, while trading below the pivot point indicates bearish sentiment.
Disclosure: I am part of Trade Nation's Influencer program and receive a monthly fee for using their TradingView charts in my analysis.
———————————
WISH YOU ALL LUCK

USOIL: Market of Sellers
Our strategy, polished by years of trial and error has helped us identify what seems to be a great trading opportunity and we are here to share it with you as the time is ripe for us to sell USOIL.
Disclosure: I am part of Trade Nation's Influencer program and receive a monthly fee for using their TradingView charts in my analysis.
❤️ Please, support our work with like & comment! ❤️

US30 Is Going Down! Sell!
Here is our detailed technical review for US30.
Time Frame: 9h
Current Trend: Bearish
Sentiment: Overbought (based on 7-period RSI)
Forecast: Bearish
The market is approaching a significant resistance area 41,575.9.
Due to the fact that we see a positive bearish reaction from the underlined area, I strongly believe that sellers will manage to push the price all the way down to 40,381.8 level.
P.S
We determine oversold/overbought condition with RSI indicator.
When it drops below 30 - the market is considered to be oversold.
When it bounces above 70 - the market is considered to be overbought.
Disclosure: I am part of Trade Nation's Influencer program and receive a monthly fee for using their TradingView charts in my analysis.
Like and subscribe and comment my ideas if you enjoy them!

EURNZD Will Fall! Short!
Take a look at our analysis for EURNZD.
Time Frame: 8h
Current Trend: Bearish
Sentiment: Overbought (based on 7-period RSI)
Forecast: Bearish
The market is on a crucial zone of supply 1.899.
The above-mentioned technicals clearly indicate the dominance of sellers on the market. I recommend shorting the instrument, aiming at 1.880 level.
P.S
Overbought describes a period of time where there has been a significant and consistent upward move in price over a period of time without much pullback.
Disclosure: I am part of Trade Nation's Influencer program and receive a monthly fee for using their TradingView charts in my analysis.
Like and subscribe and comment my ideas if you enjoy them!
