Are you shorting the bounce or waiting for confirmation?Japan’s Q1 GDP came in worse than expected: -0.2% QoQ (-0.7% annualized). Weak consumption, soft exports, and a fading external boost despite a weak yen isn't a great combo for Asia’s largest export economy.
The Nikkei 225 reacted immediately, and the H4 chart is starting to reflect deeper structural pressure.
🔍 Technical Outlook:
- Price reversed from the high of 38,745.
- Price is testing the 50 SMA and could enter the Ichimoku cloud.
- The cloud is signalling a twist, which could be a sign of momentum fading and the trend weakening or reversing.
📊 Projection:
If the price closes below the 50 SMA and breaks through the cloud, further downside could be expected, with the target levels at
- 36,800 (last consolidation zone), and
- 35,570 (38.2% fibonacci retracement level and 200 SMA).
Alternatively, if the bulls defend the cloud, we could see the price climb to the resistance level of 40,500
This is a classic macro meets technicals moment. A weak data print is lining up against the possibility of a technical rollover.
Short

AUDUSD Massive Short! SELL!
My dear friends,
My technical analysis for AUDUSD is below:
The market is trading on 0.6454 pivot level.
Bias - Bearish
Technical Indicators: Both Super Trend & Pivot HL indicate a highly probable Bearish continuation.
Target - 0.6420
About Used Indicators:
A pivot point is a technical analysis indicator, or calculations, used to determine the overall trend of the market over different time frames.
Disclosure: I am part of Trade Nation's Influencer program and receive a monthly fee for using their TradingView charts in my analysis.
———————————
WISH YOU ALL LUCK

GBPCHF Buyers In Panic! SELL!
My dear subscribers,
GBPCHF looks like it will make a good move, and here are the details:
The market is trading on 1.1152 pivot level.
Bias - Bearish
My Stop Loss - 1.1212
Technical Indicators: Both Super Trend & Pivot HL indicate a highly probable Bearish continuation.
Target - 1.1032
About Used Indicators:
The average true range (ATR) plays an important role in 'Supertrend' as the indicator uses ATR to calculate its value. The ATR indicator signals the degree of price volatility.
Disclosure: I am part of Trade Nation's Influencer program and receive a monthly fee for using their TradingView charts in my analysis.
———————————
WISH YOU ALL LUCK

SHORT NZD/CNH 8H Investment Opportunity
Hello, I am trader Andrea Russo and today I want to talk to you about a SHORT investment opportunity on the NZD/CNH exchange rate.
Trade Details
The trade starts at the 4.40 area with a Stop Loss (SL) at 4.44 and a Take Profit (TP) at 4.21.
Market Analysis
Currently, the NZD/CNH exchange rate is around 4.381. The recent performance of the NZD has shown some volatility, influenced by economic factors such as inflation in New Zealand and trade policies. These elements have contributed to creating a context of uncertainty that could favor a decline in the exchange rate.
Trading Strategy
The proposed strategy involves entering a SHORT position at 4.40, anticipating a decline towards the level of 4.21. The Stop Loss at 4.44 is used to limit losses in case the market moves against our prediction. This setup offers a good risk/reward ratio, making the trade interesting for traders looking for short-term profit opportunities.
Final Thoughts
This trading opportunity requires careful risk management and constant monitoring of market conditions. The volatility of the NZD/CNH exchange rate can offer good profit opportunities, but it is essential to be prepared to react quickly to changes. It is advisable to stay updated on economic news and events that could affect the market.
Happy trading!

GOLD: Short Signal with Entry/SL/TP
GOLD
- Classic bearish setup
- Our team expects bearish continuation
SUGGESTED TRADE:
Swing Trade
Short GOLD
Entry Point - 3203.1
Stop Loss - 3212.0
Take Profit - 3181.7
Our Risk - 1%
Start protection of your profits from lower levels
Disclosure: I am part of Trade Nation's Influencer program and receive a monthly fee for using their TradingView charts in my analysis.
❤️ Please, support our work with like & comment! ❤️

GBPNZD The Target Is DOWN! SELL!
My dear subscribers,
This is my opinion on the GBPNZD next move:
The instrument tests an important psychological level 2.2639
Bias - Bearish
Technical Indicators: Supper Trend gives a precise Bearish signal, while Pivot Point HL predicts price changes and potential reversals in the market.
Target - 2.2493
About Used Indicators:
On the subsequent day, trading above the pivot point is thought to indicate ongoing bullish sentiment, while trading below the pivot point indicates bearish sentiment.
Disclosure: I am part of Trade Nation's Influencer program and receive a monthly fee for using their TradingView charts in my analysis.
———————————
WISH YOU ALL LUCK

GOLD - Price can continue to decline to support levelHi guys, this is my overview for XAUUSD, feel free to check it and write your feedback in comments👊
A few days ago price reached $3075 level, broke it, and then rose a little, but soon turned around and made correction movement.
Next, price entered to triangle, where it reached support line, at once, and then made an upward impulse.
Price broke $3075 level and soon reached and broke too $3290 level, after which Gold rose to resistance line.
After this, price turned around and corrected $3290 level, but then it came back to resistance line.
But recently, Gold dropped to support line of triangle, breaking $3290 level and making a gap, after which it exited from triangle.
Now I think XAU can make a retest, after exiting, and then continue to decline to $3075 support level.
If this post is useful to you, you can support me with like/boost and advice in comments❤️

BITCOIN Will Go Down! Short!
Take a look at our analysis for BITCOIN.
Time Frame: 6h
Current Trend: Bearish
Sentiment: Overbought (based on 7-period RSI)
Forecast: Bearish
The market is on a crucial zone of supply 102,528.88.
The above-mentioned technicals clearly indicate the dominance of sellers on the market. I recommend shorting the instrument, aiming at 97,324.69 level.
P.S
Please, note that an oversold/overbought condition can last for a long time, and therefore being oversold/overbought doesn't mean a price rally will come soon, or at all.
Disclosure: I am part of Trade Nation's Influencer program and receive a monthly fee for using their TradingView charts in my analysis.
Like and subscribe and comment my ideas if you enjoy them!

EURUSD Will Move Lower! Sell!
Please, check our technical outlook for EURUSD.
Time Frame: 12h
Current Trend: Bearish
Sentiment: Overbought (based on 7-period RSI)
Forecast: Bearish
The price is testing a key resistance 1.118.
Taking into consideration the current market trend & overbought RSI, chances will be high to see a bearish movement to the downside at least to 1.090 level.
P.S
The term oversold refers to a condition where an asset has traded lower in price and has the potential for a price bounce.
Overbought refers to market scenarios where the instrument is traded considerably higher than its fair value. Overvaluation is caused by market sentiments when there is positive news.
Disclosure: I am part of Trade Nation's Influencer program and receive a monthly fee for using their TradingView charts in my analysis.
Like and subscribe and comment my ideas if you enjoy them!

CVNA - Carvana at upper extreme. I'm shorting again!I stand by my posts about CVNA.
It's fishiy and it stinks!
Chart wise, price is at the upper extreme again.
A nice short is setting up, and this time for a much larger move...I think, feel, expect.
"...but, isn't there more to say? You MUST explain WHY and WHEN...", I have people saying.
No, it's not a joke.
I leave it with that §8-)

EURJPY Will Fall! Short!
Here is our detailed technical review for EURJPY.
Time Frame: 6h
Current Trend: Bearish
Sentiment: Overbought (based on 7-period RSI)
Forecast: Bearish
The market is approaching a significant resistance area 164.491.
Due to the fact that we see a positive bearish reaction from the underlined area, I strongly believe that sellers will manage to push the price all the way down to 163.510 level.
P.S
The term oversold refers to a condition where an asset has traded lower in price and has the potential for a price bounce.
Overbought refers to market scenarios where the instrument is traded considerably higher than its fair value. Overvaluation is caused by market sentiments when there is positive news.
Disclosure: I am part of Trade Nation's Influencer program and receive a monthly fee for using their TradingView charts in my analysis.
Like and subscribe and comment my ideas if you enjoy them!

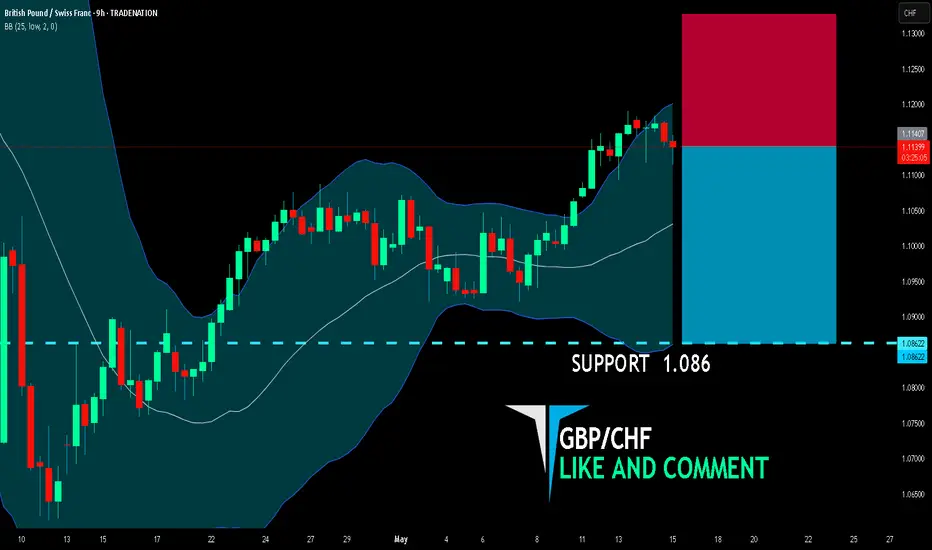
GBP/CHF SHORT FROM RESISTANCE
GBP/CHF SIGNAL
Trade Direction: short
Entry Level: 1.114
Target Level: 1.086
Stop Loss: 1.132
RISK PROFILE
Risk level: medium
Suggested risk: 1%
Timeframe: 9h
Disclosure: I am part of Trade Nation's Influencer program and receive a monthly fee for using their TradingView charts in my analysis.
✅LIKE AND COMMENT MY IDEAS✅
EUR/NZD SENDS CLEAR BEARISH SIGNALS|SHORT
Hello, Friends!
EUR/NZD pair is trading in a local downtrend which know by looking at the previous 1W candle which is red. On the 5H timeframe the pair is going up. The pair is overbought because the price is close to the upper band of the BB indicator. So we are looking to sell the pair with the upper BB line acting as resistance. The next target is 1.891 area.
Disclosure: I am part of Trade Nation's Influencer program and receive a monthly fee for using their TradingView charts in my analysis.
✅LIKE AND COMMENT MY IDEAS✅

SILVER BEARS ARE STRONG HERE|SHORT
SILVER SIGNAL
Trade Direction: short
Entry Level: 3,303.1
Target Level: 3,253.1
Stop Loss: 3,336.4
RISK PROFILE
Risk level: medium
Suggested risk: 1%
Timeframe: 2h
Disclosure: I am part of Trade Nation's Influencer program and receive a monthly fee for using their TradingView charts in my analysis.
✅LIKE AND COMMENT MY IDEAS✅

An Unharmonious Outlook for the New WeekGold Bullish? Sure, go ahead, but let me explain where we are and so on... 🤔
1. Newswise 📰
Tariffwar:
Trade tensions between the U.S. and China have intensified following President Trump's tariff hikes. The U.S. increased tariffs on Chinese imports to 145%, while China retaliated with tariffs up to 125% on U.S. goods. Despite these escalations, both countries have engaged in high-level negotiations in Geneva, aiming to de-escalate the situation. However, a recent abrupt withdrawal by the Chinese delegation has cast doubt on the progress of these talks. Analysts caution that even if an agreement is reached, it may offer only temporary relief, leaving markets exposed to prolonged trade tensions.
Federal Reserve does not cut interest rates:
President Donald Trump has been vocal in his criticism of the Federal Reserve’s decision to keep interest rates unchanged, calling Fed Chair Jerome Powell a “fool” for not lowering them. 😡 Trump argues that with falling energy prices, stable employment, and low inflation, the Fed should cut rates to stimulate economic growth. 📉
The Federal Reserve, however, remains cautious. 🏦 Officials have expressed concerns that recent tariffs could increase inflation, making premature rate cuts risky. They emphasize the need for clearer economic data before making further policy adjustments. 🧐
In summary: While Trump pushes for immediate cuts to boost the economy, the Fed is taking a measured approach, prioritizing long-term stability over short-term political pressure. ⚖️
War in Ukraine remains tense:
Western leaders, alongside President Zelensky, are calling for a 30-day ceasefire starting May 12. Russia has shown a willingness to negotiate but demands an end to Western military aid — a condition firmly rejected. 🚨
Conclusion: The coming days will be critical. A ceasefire could open the door to new peace efforts. If rejected, expect tougher sanctions and further escalation. 💥
India–Pakistan Conflict:
Tensions between India and Pakistan have escalated sharply following a militant attack on Indian tourists in Kashmir on April 22, 2025. India responded with airstrikes, prompting mutual accusations of missile and drone attacks. 💣 Despite a U.S.-brokered ceasefire announced on May 10, violations followed within hours. Both countries, nuclear-armed, have mobilized troops along the Line of Control. ⚔️ Global powers — including the U.S., U.K., China, and G7 — have urged restraint and offered to mediate. 🌍
2. Technicalwise 📊
1h Timeframe – Bearish Anti-Gartley Pattern
15m Timeframe – Bearish Anti-Butterfly Pattern
That’s not a sign of gold being bullish in the short term. 🚫
Let’s take a look at RSI values across timeframes:
- 5m – 31 – Down ⬇️
- 15m – 37 – Down ⬇️
- 30m – 43 – Down ⬇️
- 1h – 45 – Down ⬇️
- 4h – 46 – Down ⬇️
- 1d – 55 – Up ⬆️
Interpretation of RSI Values 🧐
5m to 4h (31 to 46 – all “Down”)
→ These low RSI values (below 50) across short- to mid-term timeframes indicate ongoing selling pressure and downward momentum. Although not yet in oversold territory (<30), this still signals relative weakness. ⚠️
1d (55 – “Up”)
→ On the daily chart, the RSI is above 50 and rising, suggesting a possible trend reversal or early signs of recovery — a bullish signal over the longer term. 📈
Overall Meaning 🧠
This points to short-term weakness within a broader potential uptrend. The market is soft on lower timeframes — likely in correction or consolidation — while the daily chart begins to show strength. It's a classic pullback setup in an uptrend. 🔄
Possible Strategy Consideration 💡
If you're leaning bullish, look for reversal signals on the smaller timeframes to align entries with the daily trend — such as RSI divergences or breakouts above local resistance. 📊
My Bias 🤔
Bearish sentiment dominates in the short term. Over the next week, I aim to enter short positions targeting $3,200. 📉
If sentiment shifts or key news emerges, a target of $3,400 becomes more realistic. 🚀
-------------------------------------------------------------------------
This is just my personal market idea and not financial advice! 📢 Trading gold and other financial instruments carries risks – only invest what you can afford to lose. Always do your own analysis, use solid risk management, and trade responsibly.
Good luck and safe trading! 🚀📊

USDCAD: Short Signal Explained
USDCAD
- Classic bearish formation
- Our team expects fall
SUGGESTED TRADE:
Swing Trade
Sell USDCAD
Entry Level - 1.3963
Sl - 1.4002
Tp - 1.3895
Our Risk - 1%
Start protection of your profits from lower levels
Disclosure: I am part of Trade Nation's Influencer program and receive a monthly fee for using their TradingView charts in my analysis.
❤️ Please, support our work with like & comment! ❤️

AUDCHF: Short Trade with Entry/SL/TP
AUDCHF
- Classic bearish formation
- Our team expects pullback
SUGGESTED TRADE:
Swing Trade
Short AUDCHF
Entry - 0.5411
Sl - 0.5440
Tp - 0.5354
Our Risk - 1%
Start protection of your profits from lower levels
Disclosure: I am part of Trade Nation's Influencer program and receive a monthly fee for using their TradingView charts in my analysis.
❤️ Please, support our work with like & comment! ❤️

GBPUSD: Market Sentiment & Price Action
The price of GBPUSD will most likely collapse soon enough, due to the supply beginning to exceed demand which we can see by looking at the chart of the pair.
Disclosure: I am part of Trade Nation's Influencer program and receive a monthly fee for using their TradingView charts in my analysis.
❤️ Please, support our work with like & comment! ❤️

EURUSD: Bearish Continuation
Our strategy, polished by years of trial and error has helped us identify what seems to be a great trading opportunity and we are here to share it with you as the time is ripe for us to sell EURUSD.
Disclosure: I am part of Trade Nation's Influencer program and receive a monthly fee for using their TradingView charts in my analysis.
❤️ Please, support our work with like & comment! ❤️

HK50 Short 1. This trade is against the H4 trend however, there is a pattern on M15 and M30
2. All timeframes are overbought, and there is a triple top with divergence
3. This is the week's high, and it will have a lot of resistance at this level.
4. Stop loss of 200 pips
5. 1st target is at 23150

SPY Broke The Sine-Wave Center - Not GoodWe see the 3 tiny arrows—proof that price was rejected by those who knew.
The Trend Barrier, once solid support, cracked without resistance. Price dropped right back into the Medianline set.
The small pullback? Totally expected—just like the Medianline rules suggest. Then came the brutal drop, textbook-style, straight to the Centerline.
The springboard move back up to the U-MLH and the Trend Barrier? No surprise—if you understand the Medianline Framework. Because this is just P2.
Also—watch the white line. That’s what I call the Sine Wave. Why does it matter? Because the center point (where the red pullback arrow is) often gets breached in a fake move... right before price reverses hard. From P2: down, down, down... lower than P1.
AND THAT SHOULD SCARE THE HELL OUT OF YOU!
…if I’m right 😈
But if it fails?
Then we’re looking at a monstrous V-shape recovery—one that could send the indexes skyrocketing.
So there you have it.
What’s your direction?
Let me know—and tell me why! §8-)

USDJPY Will Fall! Sell!
Please, check our technical outlook for USDJPY.
Time Frame: 9h
Current Trend: Bearish
Sentiment: Overbought (based on 7-period RSI)
Forecast: Bearish
The price is testing a key resistance 147.944.
Taking into consideration the current market trend & overbought RSI, chances will be high to see a bearish movement to the downside at least to 146.291 level.
P.S
The term oversold refers to a condition where an asset has traded lower in price and has the potential for a price bounce.
Overbought refers to market scenarios where the instrument is traded considerably higher than its fair value. Overvaluation is caused by market sentiments when there is positive news.
Disclosure: I am part of Trade Nation's Influencer program and receive a monthly fee for using their TradingView charts in my analysis.
Like and subscribe and comment my ideas if you enjoy them!

DJI – Ready for the Final ActAfter the breakdown below the last support on March 11th, the price pulled back and formed P2.
A frightening drop followed, reaching P3, then a sharp V-shaped recovery up to point (4)—just a few points shy of the Center Line.
If P2 doesn’t get taken out, things could turn ugly again. Because in that case, my new target lies below the white Lower Median Line Parallel, at P5.
Nothing is certain—never has been. But these days, *everything* feels off balance.
The moves are insane. Governments trading ahead of the news, making hundreds of millions at the expense of ordinary people. It’s like reality has left the building.
Tiny positions. Tight stops. Very high risk-reward ratios. And absolutely zero FOMO.
That’s how these markets must be traded.
Anything else, and we’re bound to get wrecked.
\#backfromcontemplation
