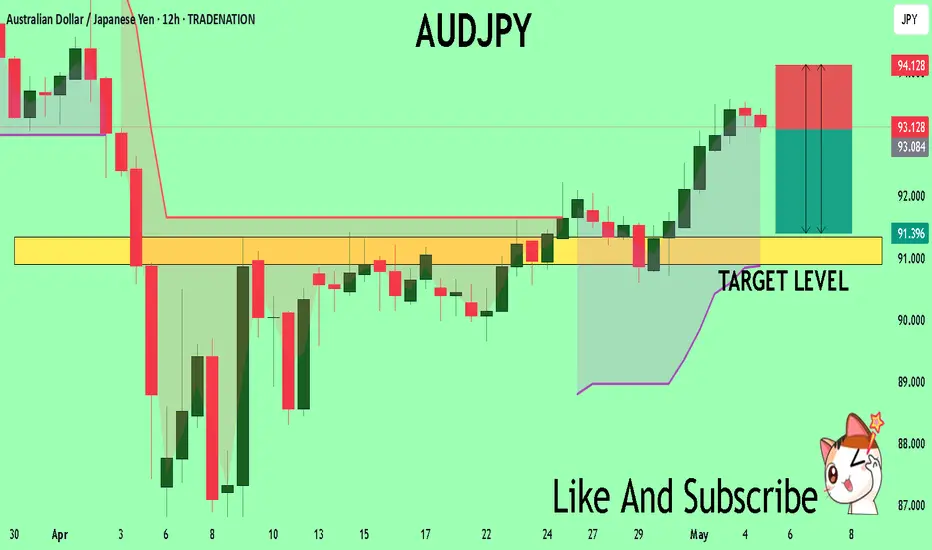
AUDJPY Buyers In Panic! SELL!
My dear subscribers,
AUDJPY looks like it will make a good move, and here are the details:
The market is trading on 93.104 pivot level.
Bias - Bearish
My Stop Loss - 94.128
Technical Indicators: Both Super Trend & Pivot HL indicate a highly probable Bearish continuation.
Target - 91.339
About Used Indicators:
The average true range (ATR) plays an important role in 'Supertrend' as the indicator uses ATR to calculate its value. The ATR indicator signals the degree of price volatility.
Disclosure: I am part of Trade Nation's Influencer program and receive a monthly fee for using their TradingView charts in my analysis.
———————————
WISH YOU ALL LUCK
Short
CHF/JPY BEARS ARE GAINING STRENGTH|SHORT
Hello, Friends!
CHF/JPY is making a bullish rebound on the 2H TF and is nearing the resistance line above while we are generally bearish biased on the pair due to our previous 1W candle analysis, thus making a trend-following short a good option for us with the target being the 174.161 level.
Disclosure: I am part of Trade Nation's Influencer program and receive a monthly fee for using their TradingView charts in my analysis.
✅LIKE AND COMMENT MY IDEAS✅

GOLD The Target Is DOWN! SELL!
My dear friends,
My technical analysis for GOLD is below:
The market is trading on 3377.8 pivot level.
Bias - Bearish
Technical Indicators: Both Super Trend & Pivot HL indicate a highly probable Bearish continuation.
Target - 3357.7
Recommended Stop Loss - 3387.7
About Used Indicators:
A pivot point is a technical analysis indicator, or calculations, used to determine the overall trend of the market over different time frames.
Disclosure: I am part of Trade Nation's Influencer program and receive a monthly fee for using their TradingView charts in my analysis.
———————————
WISH YOU ALL LUCK

BTC - Golden Pocket test & what comes next?Bitcoin (BTC) has been steadily recovering from its January correction, entering a promising uptrend that has now brought it to a crucial technical juncture: the Golden Pocket Fibonacci zone, which lies between the 61.8% and 65% retracement levels. This area is widely watched by traders, as it often serves as a springboard for either significant reversals or continuation of the trend.
4H timeframe
On the 4H timeframe, BTC recently formed an ascending triangle, a classic bullish continuation pattern. The price managed to break above the triangle’s resistance, but it failed to hold above this level, closing back below the breakout zone. This lack of follow-through signals weakness and suggests that a short-term pullback could be imminent.
Daily timeframe
Turning to the daily chart, the situation becomes even clearer. After reaching the Golden Pocket, BTC printed a bearish engulfing candlestick, a strong reversal signal. The subsequent price action saw BTC break below both the 4H support and a daily FVG, further strengthening the case for a deeper correction or trend reversal. If this downward momentum continues, the next major support zone is likely between $89,000 and $91,000. This area marks an imbalance created during the previous rally and is a natural target for buyers to step in.
However, the bullish scenario is not entirely off the table. If BTC can reclaim and hold above the Golden Pocket, it would signal a resumption of the uptrend, with the next key target being the psychologically significant $100,000 level. For now, though, the technical structure suggests that a retracement toward the $89–91k zone is more likely before any attempt at new highs.
Conclusion
In summary, Bitcoin’s recent test of the Golden Pocket Fibonacci zone has resulted in a short-term rejection. The immediate outlook is cautious, with a likely retracement toward $89–91k. Traders should watch closely for confirmation signals in both price action and volume before making new commitments. A successful hold above the Golden Pocket would open the door for a rally toward $100,000, but for now, patience and careful observation are advised.
Thanks for your support.
- Make sure to follow me so you don't miss out on the next analysis!
- Drop a like and leave a comment!

MSTR Bull Trap!In my BKC charting, I’ve identified a pattern I call "tight! tight! tight!" typically paired with a bull trap. Prices surge as traders FOMO in, then collapse. It’s a straightforward trade: enter on the breakdown, set a stop above the prior high. Offers solid risk/reward.
Click like, follow, subscribe! Let me help you navigate these crazy markets. Lets get to 5,000 followers,

AUDUSD: Short Signal with Entry/SL/TP
AUDUSD
- Classic bearish formation
- Our team expects pullback
SUGGESTED TRADE:
Swing Trade
Short AUDUSD
Entry - 0.6477
Sl - 0.6503
Tp - 0.6429
Our Risk - 1%
Start protection of your profits from lower levels
Disclosure: I am part of Trade Nation's Influencer program and receive a monthly fee for using their TradingView charts in my analysis.
❤️ Please, support our work with like & comment! ❤️

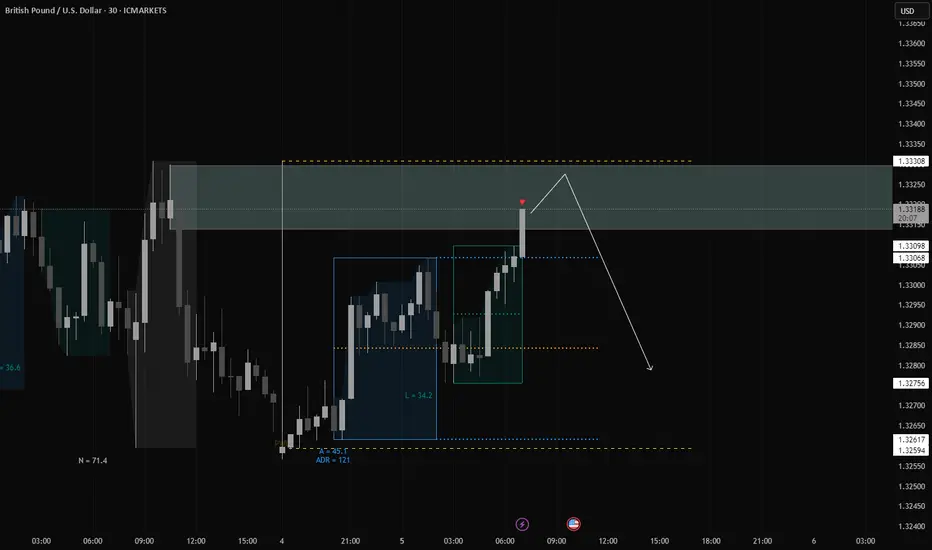
GBPUSD: Bearish Continuation is Highly Probable! Here is Why:
The analysis of the GBPUSD chart clearly shows us that the pair is finally about to tank due to the rising pressure from the sellers.
Disclosure: I am part of Trade Nation's Influencer program and receive a monthly fee for using their TradingView charts in my analysis.
❤️ Please, support our work with like & comment! ❤️

GOLD: Short Signal Explained
GOLD
- Classic bearish pattern
- Our team expects retracement
SUGGESTED TRADE:
Swing Trade
Sell GOLD
Entry - 3311.9
Stop - 3324.4
Take - 3287.1
Our Risk - 1%
Start protection of your profits from lower levels
Disclosure: I am part of Trade Nation's Influencer program and receive a monthly fee for using their TradingView charts in my analysis.
❤️ Please, support our work with like & comment! ❤️

XAUUSD Shortshorting XAUUSD with TP and SL as per chart
XAUUSD will be short because there BOS (Break Of Structure) before.

GBPUSD Sell AreaHello everyone, we got a potential sell zone around this zone for GBPUSD.
HTF Trends (D & W) indicate a bearish trend and it does seem like GBPUSD might be seeking to take out liquidity before continuing its move.
For my entry confirmation I will be looking out for rejection and see if we can get any clear patterns.
I expect the move to happen at most late during new york session.
Let me know your thoughts!
Bitcoin Ascending Broadening Wedge (4H)After a clean breakout above the macro downtrend, BINANCE:BTCUSDT rallied into its supply zone — but price action has since become increasingly volatile, forming a rising broadening wedge (also known as a megaphone pattern).
Pattern Insights
• The structure is defined by diverging trendlines, with each swing becoming larger and more erratic.
• This pattern often signals instability or exhaustion, especially near key resistance.
• While it can break either way, broadening wedges in an uptrend frequently resolve to the downside, especially when supply is overhead.
Key Levels
• Resistance: ~$ 98K-$99.5k supply zone — the upper boundary of the pattern.
• Support: ~$93.5k area — prior S/R, potential flip zone.
• Reversal: A breakdown below ~$93k could confirm a short-term bearish resolution and open the door to ~$88.5k.
• Continuation: A breakout above the upper boundary with volume could trap shorts and ignite a squeeze toward new highs.
Until then, BTC remains in a high-volatility structure, best approached with caution or as a range-trading opportunity.

05/05/25 Weekly OutlookLast weeks high: $97,941.18
Last weeks low: $92,845.16
Midpoint: $95,393.17
FOMC week returns once again on Wednesday, the forecast suggests no change to the interest rate is expected with 4.5% staying as is. The tariff acceleration we saw last month brought into question the timing of rate cuts and if they would be brought forward, it looks like this FOMC is too early to see a cut but it is coming in the future if president Trump gets his way.
The chart is an interesting one but one that isn't too surprising. The orderblock that sent Bitcoins price to $74,500 was at ~$97,000, naturally that area would be major resistance and so a huge amount of Stop Losses were placed there, price swept that supply zone wiping out SL and SFP back under the resistance zone, a textbook move.
An accumulation under the resistance area would be a sign that the bulls are building to flip the zone, however a gradual sell-off from here would then look like a HTF lower high, a very bearish pattern.
Going into the FED interest rate decision there is usually a lot of de-risking/ sidelining from traders until the decision is made, therefor the second half of the week would give us more directional information.

EURUSD Will Fall! Short!
Here is our detailed technical review for EURUSD.
Time Frame: 4h
Current Trend: Bearish
Sentiment: Overbought (based on 7-period RSI)
Forecast: Bearish
The market is trading around a solid horizontal structure 1.133.
The above observations make me that the market will inevitably achieve 1.125 level.
P.S
We determine oversold/overbought condition with RSI indicator.
When it drops below 30 - the market is considered to be oversold.
When it bounces above 70 - the market is considered to be overbought.
Disclosure: I am part of Trade Nation's Influencer program and receive a monthly fee for using their TradingView charts in my analysis.
Like and subscribe and comment my ideas if you enjoy them!

EURAUD Will Go Down From Resistance! Sell!
Take a look at our analysis for EURAUD.
Time Frame: 9h
Current Trend: Bearish
Sentiment: Overbought (based on 7-period RSI)
Forecast: Bearish
The market is testing a major horizontal structure 1.747.
Taking into consideration the structure & trend analysis, I believe that the market will reach 1.713 level soon.
P.S
Overbought describes a period of time where there has been a significant and consistent upward move in price over a period of time without much pullback.
Disclosure: I am part of Trade Nation's Influencer program and receive a monthly fee for using their TradingView charts in my analysis.
Like and subscribe and comment my ideas if you enjoy them!

GOLD SENDS CLEAR BEARISH SIGNALS|SHORT
GOLD SIGNAL
Trade Direction: short
Entry Level: 3,270.07
Target Level: 3,197.87
Stop Loss: 3,317.86
RISK PROFILE
Risk level: medium
Suggested risk: 1%
Timeframe: 2h
Disclosure: I am part of Trade Nation's Influencer program and receive a monthly fee for using their TradingView charts in my analysis.
✅LIKE AND COMMENT MY IDEAS✅

USD/JPY BEARS ARE GAINING STRENGTH|SHORT
USD/JPY SIGNAL
Trade Direction: short
Entry Level: 144.163
Target Level: 139.852
Stop Loss: 147.018
RISK PROFILE
Risk level: medium
Suggested risk: 1%
Timeframe: 15h
Disclosure: I am part of Trade Nation's Influencer program and receive a monthly fee for using their TradingView charts in my analysis.
✅LIKE AND COMMENT MY IDEAS✅
