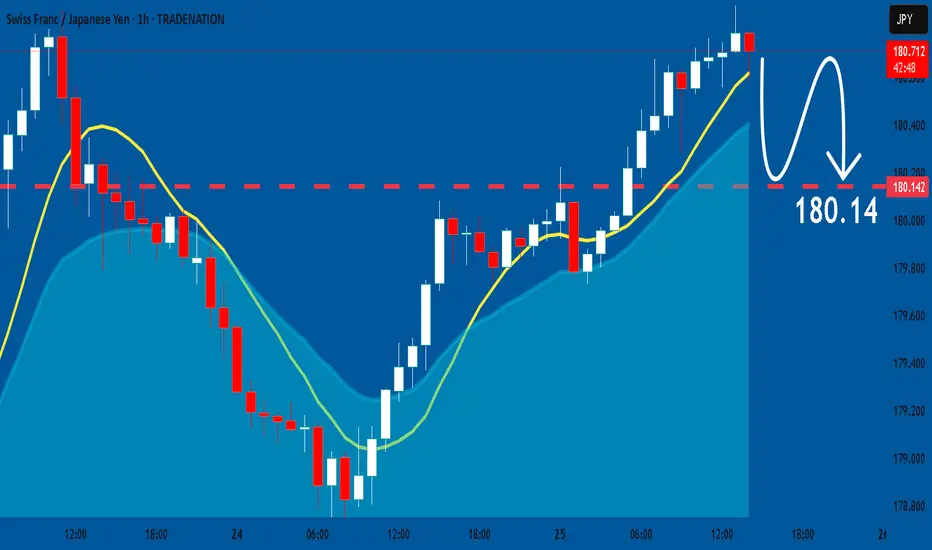
CHFJPY: Bearish Forecast & Bearish Scenario
It is essential that we apply multitimeframe technical analysis and there is no better example of why that is the case than the current CHFJPY chart which, if analyzed properly, clearly points in the downward direction.
Disclosure: I am part of Trade Nation's Influencer program and receive a monthly fee for using their TradingView charts in my analysis.
❤️ Please, support our work with like & comment! ❤️
Short
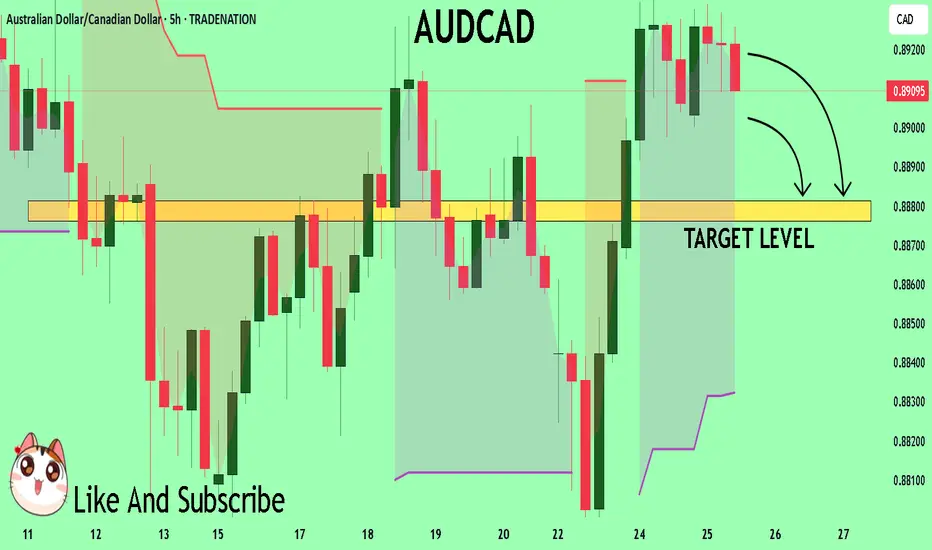
AUDCAD Massive Short! SELL!
My dear friends,
AUDCAD looks like it will make a good move, and here are the details:
The market is trading on 0.8911 pivot level.
Bias - Bearish
Technical Indicators: Supper Trend generates a clear short signal while Pivot Point HL is currently determining the overall Bearish trend of the market.
Goal - 0.8881
About Used Indicators:
Pivot points are a great way to identify areas of support and resistance, but they work best when combined with other kinds of technical analysis
Disclosure: I am part of Trade Nation's Influencer program and receive a monthly fee for using their TradingView charts in my analysis.
———————————
WISH YOU ALL LUCK
AUDJPY Under Pressure! SELL!
My dear subscribers,
This is my opinion on the AUDJPY next move:
The instrument tests an important psychological level 94.650
Bias - Bearish
Technical Indicators: Supper Trend gives a precise Bearish signal, while Pivot Point HL predicts price changes and potential reversals in the market.
Target - 94.434
About Used Indicators:
On the subsequent day, trading above the pivot point is thought to indicate ongoing bullish sentiment, while trading below the pivot point indicates bearish sentiment.
Disclosure: I am part of Trade Nation's Influencer program and receive a monthly fee for using their TradingView charts in my analysis.
———————————
WISH YOU ALL LUCK

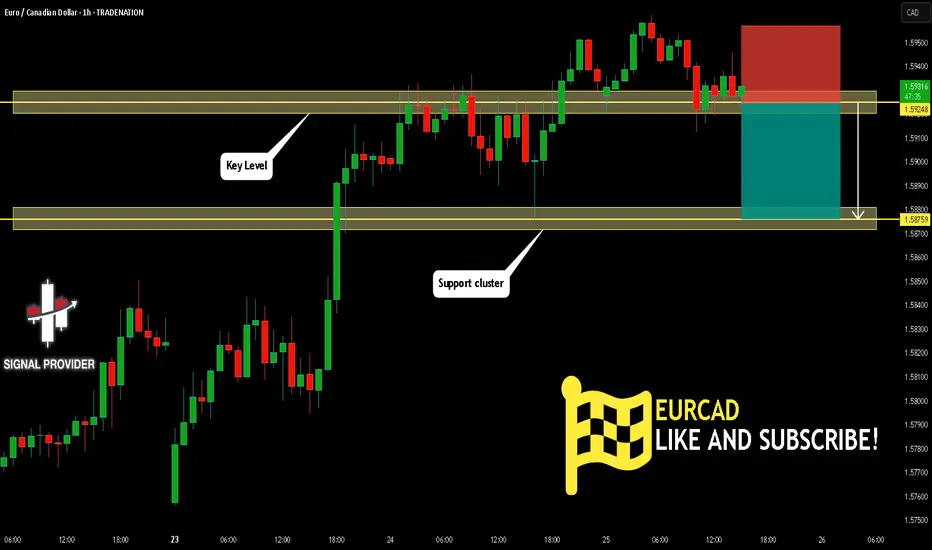
EURCAD Will Fall! Sell!
Here is our detailed technical review for EURCAD.
Time Frame: 1h
Current Trend: Bearish
Sentiment: Overbought (based on 7-period RSI)
Forecast: Bearish
The market is approaching a significant resistance area 1.592.
Due to the fact that we see a positive bearish reaction from the underlined area, I strongly believe that sellers will manage to push the price all the way down to 1.587 level.
P.S
Overbought describes a period of time where there has been a significant and consistent upward move in price over a period of time without much pullback.
Disclosure: I am part of Trade Nation's Influencer program and receive a monthly fee for using their TradingView charts in my analysis.
Like and subscribe and comment my ideas if you enjoy them!
GBPCAD Will Go Down From Resistance! Short!
Please, check our technical outlook for GBPCAD.
Time Frame: 5h
Current Trend: Bearish
Sentiment: Overbought (based on 7-period RSI)
Forecast: Bearish
The price is testing a key resistance 1.868.
Taking into consideration the current market trend & overbought RSI, chances will be high to see a bearish movement to the downside at least to 1.855 level.
P.S
The term oversold refers to a condition where an asset has traded lower in price and has the potential for a price bounce.
Overbought refers to market scenarios where the instrument is traded considerably higher than its fair value. Overvaluation is caused by market sentiments when there is positive news.
Disclosure: I am part of Trade Nation's Influencer program and receive a monthly fee for using their TradingView charts in my analysis.
Like and subscribe and comment my ideas if you enjoy them!

EUR/USD BEARS WILL DOMINATE THE MARKET|SHORT
EUR/USD SIGNAL
Trade Direction: short
Entry Level: 1.161
Target Level: 1.141
Stop Loss: 1.174
RISK PROFILE
Risk level: medium
Suggested risk: 1%
Timeframe: 10h
Disclosure: I am part of Trade Nation's Influencer program and receive a monthly fee for using their TradingView charts in my analysis.
✅LIKE AND COMMENT MY IDEAS✅

SPX500 Short There are multiple patterns on M15 and H1
All timeframes up to H4 are overbought
There are multiple double tops with divergence
This is at the all-time high, suggesting there will be a lot of resistance
Markets look like they are due for a drop after such a sharp move up\
Stop loss above 6130

HYPE: Distribution Zone — Best RR for Shorts?🎯 KUCOIN:HYPEUSDT Trading Plan:
Active Short Scenario:
Entry: $37–$45 zone
Invalidation: Daily closes above $45.8 (cut/derisk)
Partial TP: $27.5 (0.5 retrace), $22 (weekly gap), $13 (monthly demand)
No Longs:
Avoid opening fresh longs in this structure/zone
Wait for reclaim and closes above $45.8 for any long bias
🔔 Triggers & Confirmations:
Add on weakness/rejection at highs
Derisk or close if daily closes above range
🚨 Risk Warning:
Strong squeeze risk if range high breaks
Be disciplined with stops

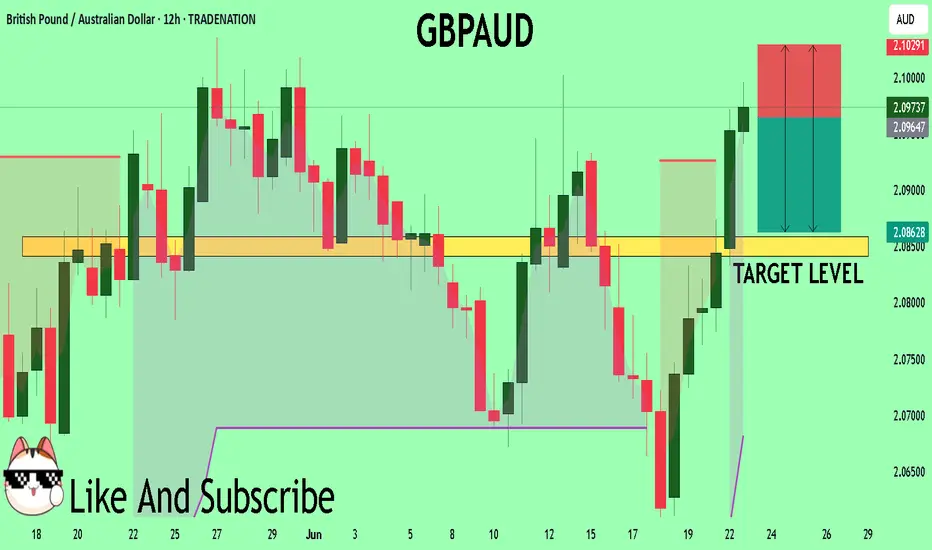
GBPAUD Trading Opportunity! SELL!
My dear friends,
Please, find my technical outlook for GBPAUD below:
The price is coiling around a solid key level - 2.0968
Bias - Bearish
Technical Indicators: Pivot Points Lowanticipates a potential price reversal.
Super trend shows a clear sell, giving a perfect indicators' convergence.
Goal - 2.0858
Safe Stop Loss - 2.1029
About Used Indicators:
The pivot point itself is simply the average of the high, low and closing prices from the previous trading day.
Disclosure: I am part of Trade Nation's Influencer program and receive a monthly fee for using their TradingView charts in my analysis.
———————————
WISH YOU ALL LUCK
GBPUSD Technical Analysis! SELL!
My dear friends,
GBPUSD looks like it will make a good move, and here are the details:
The market is trading on 1.3622 pivot level.
Bias - Bearish
Technical Indicators: Supper Trend generates a clear short signal while Pivot Point HL is currently determining the overall Bearish trend of the market.
Goal - 1.3558
Recommended Stop Loss - 1.3653
About Used Indicators:
Pivot points are a great way to identify areas of support and resistance, but they work best when combined with other kinds of technical analysis
Disclosure: I am part of Trade Nation's Influencer program and receive a monthly fee for using their TradingView charts in my analysis.
———————————
WISH YOU ALL LUCK

Euro can drop from wedge, breaking support levelHello traders, I want share with you my opinion about Euro. The price previously started a confident upward movement, breaking out from the buyer zone around 1.1075 and forming an upward wedge pattern. As the trend continued, EUR pushed through the support area and traded inside the wedge, showing multiple bounces from the support line. Eventually, the pair reached the resistance line at the top of the wedge and then reversed. After a short correction, it tried to rebound again but failed to create a new high. The market then pulled back into the support area 1.1455 - 1.1410 and is now testing that level once more. Currently, the Euro is trading just above the support area, and we may see a short-term rebound from here. However, given the overall structure, I expect the price to break the support level and exit the wedge pattern to the downside. In my opinion, this breakout will initiate a strong bearish wave, targeting the 1.1250 points, which is where I’ve set my TP 1. Given the pattern structure, recent lower highs, and the weakening bullish momentum, I remain bearish and anticipate further decline once support is broken. Please share this idea with your friends and click Boost 🚀
Disclaimer: As part of ThinkMarkets’ Influencer Program, I am sponsored to share and publish their charts in my analysis.

EURO - Price can continue to decline inside wedge patternHi guys, this is my overview for EURUSD, feel free to check it and write your feedback in comments👊
Some days ago, price tried to grow, but failed and dropped below $1.1220 support level, after which started to grow in channel.
In rising channel, price broke $1.1220 level one more time and then rose to resistance line and then corrected.
Next, Euro rose to $1.1455 level and some time traded inside this level, until it broke it and continued to move up.
Price exited from rising channel and later started to decline inside wedge pattern, where it declined to $1.1455 level.
Recently, price bounced from this level and in a short time rose to resistance line of wedge pattern.
In my mind, Euro can continue to decline to $1.1400 support line of wedge, breaking support level.
If this post is useful to you, you can support me with like/boost and advice in comments❤️
Disclaimer: As part of ThinkMarkets’ Influencer Program, I am sponsored to share and publish their charts in my analysis.

HelenP. I Gold may continue to decline to support levelHi folks today I'm prepared for you Gold analytics. After dropping from the support zone, the price of Gold found temporary support near the trend line and started to rise again. The upward movement was sharp and even created a gap while breaking through the previous support level, which then acted as resistance. For some time, the price hovered around this resistance area but failed to gain enough strength to break higher. Eventually, Gold pulled back to the trend line and began consolidating within a triangle pattern. Inside this structure, it managed to break above the resistance zone again, but this breakout turned out to be false. The price quickly reversed and dropped, breaking through the resistance level and exiting the triangle to the downside. This breakdown also shows that the bullish momentum has weakened significantly. Now, Gold is trading near the trend line again, showing hesitation and a lack of strong bullish continuation. Given this technical behavior, I expect a small rise toward the trend line, followed by a continued drop toward the support level at 3320. That’s the area I’m watching as my current goal. If you like my analytics you may support me with your like/comment ❤️
Disclaimer: As part of ThinkMarkets’ Influencer Program, I am sponsored to share and publish their charts in my analysis.

EURUSD A Fall Expected! SELL!
My dear friends,
Please, find my technical outlook for EURUSD below:
The price is coiling around a solid key level - 1.1609
Bias - Bearish
Technical Indicators: Pivot Points Low anticipates a potential price reversal.
Super trend shows a clear sell, giving a perfect indicators' convergence.
Goal - 1.1532
About Used Indicators:
The pivot point itself is simply the average of the high, low and closing prices from the previous trading day.
Disclosure: I am part of Trade Nation's Influencer program and receive a monthly fee for using their TradingView charts in my analysis.
———————————
WISH YOU ALL LUCK


GER40 Short The trend on this trade has finally started to turn so we can expect the start of the short season
H4, H1, and M15 are overbought
There are 2 clear patterns on H1 and M30
There is a head and shoulders present in M15 with massive divergence
Stoploss above 150 pips
First target at 23300

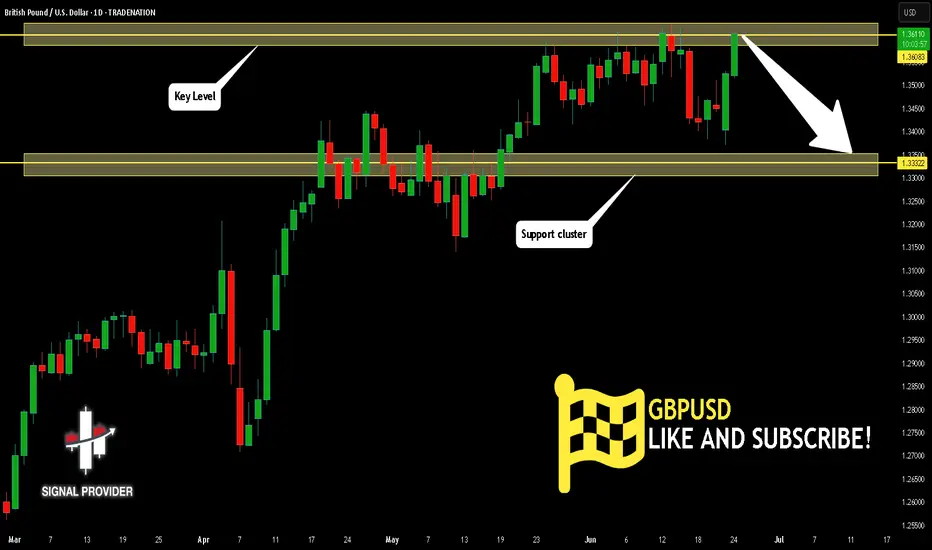
GBPUSD Will Move Lower! Sell!
Please, check our technical outlook for GBPUSD.
Time Frame: 1D
Current Trend: Bearish
Sentiment: Overbought (based on 7-period RSI)
Forecast: Bearish
The market is approaching a key horizontal level 1.360.
Considering the today's price action, probabilities will be high to see a movement to 1.333.
P.S
Please, note that an oversold/overbought condition can last for a long time, and therefore being oversold/overbought doesn't mean a price rally will come soon, or at all.
Disclosure: I am part of Trade Nation's Influencer program and receive a monthly fee for using their TradingView charts in my analysis.
Like and subscribe and comment my ideas if you enjoy them!
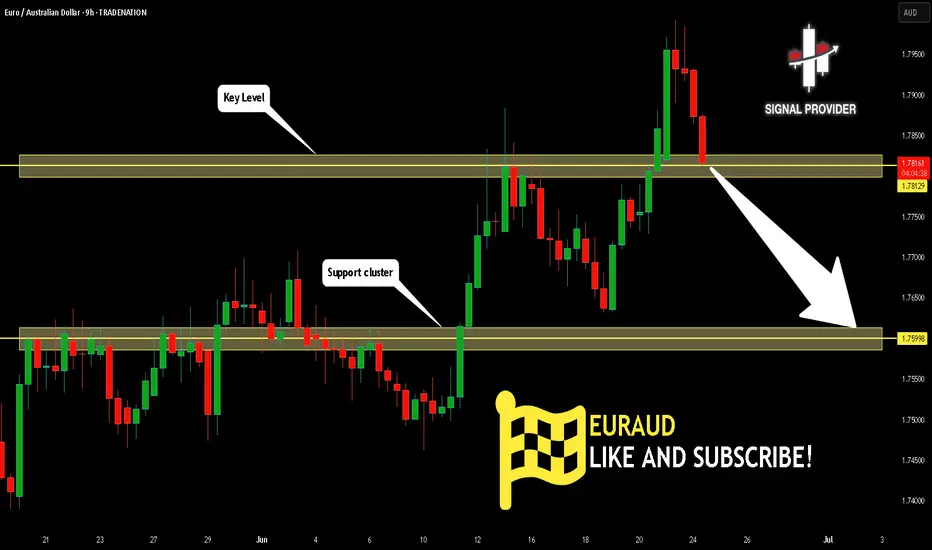
EURAUD Is Bearish! Short!
Here is our detailed technical review for EURAUD.
Time Frame: 9h
Current Trend: Bearish
Sentiment: Overbought (based on 7-period RSI)
Forecast: Bearish
The market is approaching a significant resistance area 1.781.
Due to the fact that we see a positive bearish reaction from the underlined area, I strongly believe that sellers will manage to push the price all the way down to 1.759 level.
P.S
The term oversold refers to a condition where an asset has traded lower in price and has the potential for a price bounce.
Overbought refers to market scenarios where the instrument is traded considerably higher than its fair value. Overvaluation is caused by market sentiments when there is positive news.
Disclosure: I am part of Trade Nation's Influencer program and receive a monthly fee for using their TradingView charts in my analysis.
Like and subscribe and comment my ideas if you enjoy them!
SILVER SELLERS WILL DOMINATE THE MARKET|SHORT
SILVER SIGNAL
Trade Direction: short
Entry Level: 3,612.8
Target Level: 3,572.6
Stop Loss: 3,639.3
RISK PROFILE
Risk level: medium
Suggested risk: 1%
Timeframe: 2h
Disclosure: I am part of Trade Nation's Influencer program and receive a monthly fee for using their TradingView charts in my analysis.
✅LIKE AND COMMENT MY IDEAS✅

NZD/CAD BEARISH BIAS RIGHT NOW| SHORT
NZD/CAD SIGNAL
Trade Direction: short
Entry Level: 0.827
Target Level: 0.818
Stop Loss: 0.832
RISK PROFILE
Risk level: medium
Suggested risk: 1%
Timeframe: 2h
Disclosure: I am part of Trade Nation's Influencer program and receive a monthly fee for using their TradingView charts in my analysis.
✅LIKE AND COMMENT MY IDEAS✅

AUD/CAD BEST PLACE TO SELL FROM|SHORT
Hello, Friends!
We are now examining the AUD/CAD pair and we can see that the pair is going up locally while also being in a uptrend on the 1W TF. But there is also a powerful signal from the BB upper band being nearby, indicating that the pair is overbought so we can go short from the resistance line above and a target at 0.885 level.
Disclosure: I am part of Trade Nation's Influencer program and receive a monthly fee for using their TradingView charts in my analysis.
✅LIKE AND COMMENT MY IDEAS✅

US30 - Intraday long scalp then short Looking for that intraday scalp on the long around 120 points can hold potentially further up to our higher supply level. If bearish PA is confirmed around the 43,000 level can look to take this short. All dependent on PA.

CHF/JPY BEARS ARE STRONG HERE|SHORT
Hello, Friends!
The BB upper band is nearby so CHF-JPY is in the overbought territory. Thus, despite the uptrend on the 1W timeframe I think that we will see a bearish reaction from the resistance line above and a move down towards the target at around 177.078.
Disclosure: I am part of Trade Nation's Influencer program and receive a monthly fee for using their TradingView charts in my analysis.
✅LIKE AND COMMENT MY IDEAS✅
