Start of bearish trend GBPJPYas the market has made a new lower high and the inverted bearish hammer is the strong confirmation of making it lower low.
Shortposition

GU Looking for correction then head to downside. $GBPUSD After News on 2/24/23 and After Top-Down analysis i'm looking for price to move to the downside on 2/27/23 for a short correction.
This is not trading advice or a signal!
The Website should not be relied upon as a substitute for extensive independent market research before making your actual trading decisions.

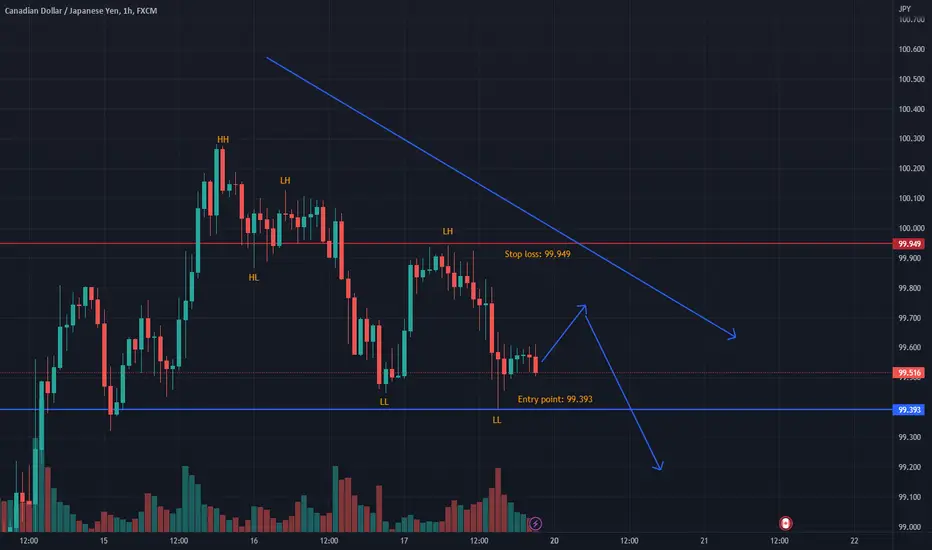
Bearish trend for CADJPYthe trend is making lower highs and lower lows, this is the indication of a bearish trend.
NVDA Simple Chart AnalysisNVDA - Rst 230.16 Supp 209.27
Sideway play or support touch to rebound again? MACD looks weak as well. If there are no high candle break on the following week, you may standby your short position on this.

It looks like a bearish flag on gold.This week's gold price is still moving in a narrow range and looks like a flag pattern. And if the prices break the trend line pattern, there is a target that could reach the price of 1828. The current price is acceptable in a bearish trade. It's not too risky. And may take profit when the price hits the lower band.


FOREX ANALYSIS : EURCHFFX:EURCHF
If you want to use this idea, please risk only one percent of your account balance.

EXPE - Descending Triangle - BearishOn the chart of Expedia (EXPE), we can see a descending triangle. A descending triangle is a bearish formation.
The price has already broken the support and is now retesting the support. When the support turns into a resistance a short position can be taken. The price is likely to drop more until it has reached its target.
All further details are shown on the chart.
Goodluck!

WMT - Broadening Wedge - BearishWMT is currently showing an ascending broadening wedge pattern on daily timeframe. An ascending broadening wedge is a bearish reversal chart pattern. Where the upper line is the resistance line and the lower line is the support line. As we can see in the chart that its moves increase with higher magnitudes. This pattern should be traded when the price breaks out of the support line.
In our opinion, it´s likely for the price to retrace and break out of the support line. When the price breaks out of the support line, a short position can be taken and the target can be targeted.
All the details are shown on the chart.
Goodluck!

XAUUSD Short PlanContinue the Wyckoff methodology and Volume Profile series, today I will do the analysis of XAUUSD. We can assume/define the Buying climax starting from Dec 15, then the price moves down to up, while the volume is just down, which means this wave may not be good - even if the price is still sideways up (Phase A). After that, take a look carefully at Phase B of this channel, the price is continuously sideways but the structure of the volume is broken with a climatic volume at the middle of the range - It is a warning signal as it should not appear as a general rule in the accumulation schemes and therefore could be a footprint to add in favor of the downward control.
Focus in Phase C - UTAD, the price tries to leave the value area of the composite profile but is strongly rejected (bear engulfing candles - Dec 27 & 28). The market is not interested in trading at higher prices and that's a new signal is added in favor of sellers.
The last signal: Do you see the price's momentum is very weak when it reaches back the UTAD?
-----
Once again, this setup looks very basic, but it's really effective. Let's follow the plan and see what will happen.

DOGEUSDT ! Retest The Support DOGEUSDT retest the support in 4H time frame which is strong support, doge retest the support and bounce back from the support with good volume RSI also below 30, It's time to open long position and our TP will be just below the resistance level.
Take trade according to your wallet size and patience.

Footlocker (FL) - Multiple tops - ShortOn this chart (1d timeframe), we can see multiple tops have appeared. Multiple tops is a bearish pattern so it's likely the price will drop. Also, there is a gap to be filled. Once the price has gone beneath the support line the trade can be entered. The price will find support in the support area, this would be the area where the profits can be taken. When it reaches the support area we expect a small bounce before it continues going down.
See further details on the chart.
Goodluck

ATOM/USDT. Price should be breakdown the channel and retest it successfully then we can open short till TP.
Open 8.869 * TP 7.792 * SL 9.348

XMR/USDT. It's going to breakdown the channel, we just wait for comeback for rest, when resetting will be confirmed then open short position at $142,4.


BTCUSD - Overbought - Short term oppurtunityOn the BTC-USD chart (1h timeframe), the price is currently overbought.
In this analysis, all three indicators are suggesting an overbought condition. The indicators used are the Bollinger Bands, RSI and Stochastics. This could mean that the price will drop when there is a confirmation of the price going down. When this happens a short position can be taken and profits can be taken.
See all further details on the chart.
Goodluck!

"ETH-USDT"FUTURES, SHORT POSITION"ETH-USDT" FUTURES
First of all please draw a horizontal line at the price of 1264.12
According to the analysis done by me ( technical analysis and price action), 15:55 UTC time is very sensitive and important, Because this time zone (15:55) where the lines of several patterns meet each other and also their meeting with the support line (1264.12).
And we must be ready to open a short (sell) position. Because by breaking the support line and seeing the confirmation candle, the possibility of a sharp drop is very high.
Attention plz
The main market trend is bearish
After breaking the support line, first get a confirmation candle and pay attention to the volume , then open your position
Don't forget capital management and set stop loss
And finally, this is only an analysis and suggestion, and the main decision-making responsibility is with you.
GOOD LUCK

CHRUSDT : Short position Hello friends . In this currency, we have reached the weekly ceiling and there is an expectation of selling in this area, so we take a selling position and the target is clear on the picture.

AUDJPY Short planBased on the Wyckoff methodology and Volume Profile, we can assume the current channel is distribution, and price potential moves down next week. If the price reverse to the 92.3 - 94.2 area, I will do a short trade at 92.6 and the 2nd entry is 94, then hold it to 84.7.
This setup looks very basic, but it's really effective. Let's follow the plan and see what will happen.

ETH the red and green line is important support and residance .if candle 1h broken with closed candle we can open sell positon under red line and buy position in green line

GOING SHORT IN AUDUSDI am taking a short position in AUDUSD because it is forming a BAT Harmonic Pattern. I have put my SL slightly tight because we don't have any confirmation about complete PATTERN unless it breaks Point B so we can take a risk to open a SHORT trade
On Daily TF it is in a bullish trend and it does not break its previous High and it forms a double TOP Pattern
Let's see what happens
