Cup and handle pattern $XPO weekly Cup and handle pattern $XPO weekly
- Cup and handle pattern forming on the weekly
- Bear flag trigger
Shortposition

USDT.D support or resistance?!I do not know you, but I'm waiting for Bitcoin to react to this important level and open my position according to the behavior of candlesticks at this level. Wait for me
Have a good trade ;)

USDT.DSee the shadows of the candles The buying pressure during these four days is very high and the market may go down at any moment.
Have a good trade ;)

GMT Short PostionThis is the third top. I bet to short for GMT
Price is at retest area under trendline.


Double top $APPS with bear flag triggerDouble top $APPS with bear flag trigger
- Double top on the weekly
- Price below neck line and POC
- Bear flag for a good trigger or add position on the down side

FTSE100 Major Resistance Coming up ahead of CPI DATA SHORT I will be looking to take a short based on the following analysis .
FTSE Approaching Major resistance with a HVN *High Volume Node up ahead as well as untapped Monthly and Daily levels .
If this plays out I would expect PA to gravitate down to the 0.618 FIB for a strong level of support
Housing the 9 , 30 , 50 and the 100EMAS all clustered in-between the 0.66 and the 0.618 FIB as well as a SPEED FAN 0.5 crossing through this range 7350.
The Analysis does coincide with some Fundamental data released tomorrow for the UK "CPI DATA YoY " Consumer Price Index in which case
the actual CPI numbers have been higher than forecast spanning the past 18+ months so this could be the precursor for the drop tomorrow with a continuation of that trend.
Please like and follow for regular analysis . Much appreciation
* Left out the EMAs too keep the chart looking clear


EUR AUD ShortEUR AUD formed a head and shoulders pattern that is heading downwards and on the right side of the pattern has also formed a reverse falling wedge and has retested so that the targets are TP 1 and even TP 2. But if the HNS pattern is perfectly formed then the targets are TP 3 and TP 4. can go to TP Bonus.

Daily Short Parabolic Stock Ideas for my followers!! Follow Me I decided to start this new format to take advantage of short opportunities that arise when a week stock has gone parabolic.
I have some criteria to sift through opportunities and choose the best:
1) The company is relatively unknown (normally belongs to the OTC market) and financially weak (medical companies normally satisfy these criteria)
2) The company has been on a long downtrend
3) The company has made a large move to the upside (greater or equal to 15%; NEVER SPECULATE ON A COMPANY THAT HAS RISEN LESS THAN THAT IN FIRST DAY OF EXPLOSION). Also consider that the green explosion has to be from a relatively full green candle.
4) Before the upside movement, the chart should have formed a falling wedge (which it has broken after the first great upward movement)
5) After several days, an inversion pattern should form (most usually a double top) and that pattern can be used to short the stock according to standard rules
Short stocks to keep an eye on for short opportunities:
1) KALA
2) KAVL
3) COE
4) LBPS

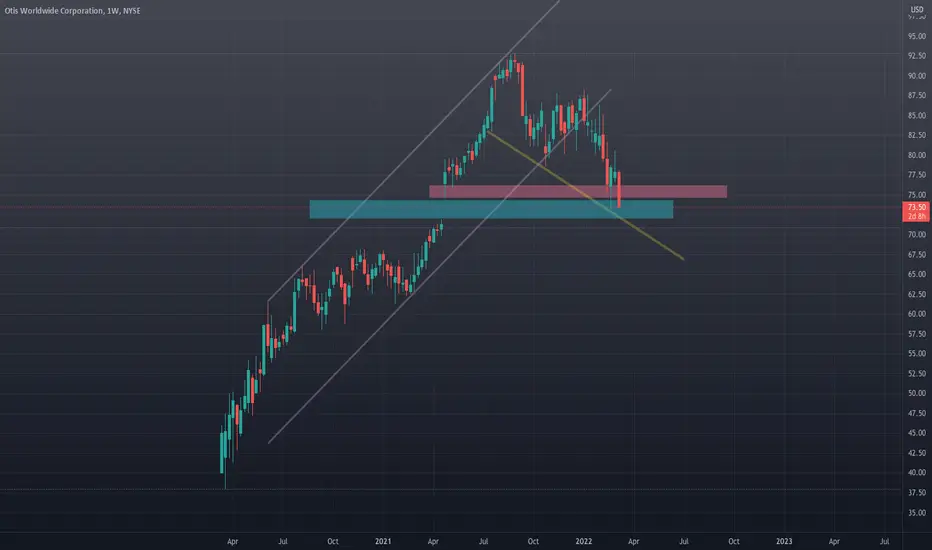
Lift is breaking down $OTIS- Know when is the top
- Dont have to FOMO as there are millions and millions of set up / assets
- Identify the top
- Wait for price to go below 10/ 40
- Wait for formation to appear
- Very clean chart
- Break down uptrend support line
- Break down the support line
- Gap to fill
Trend line broke down $COFTrend line broke down $COF
- Broke down all trend lines / descending triangle
- Heavy selling at top
- Wait for trigger

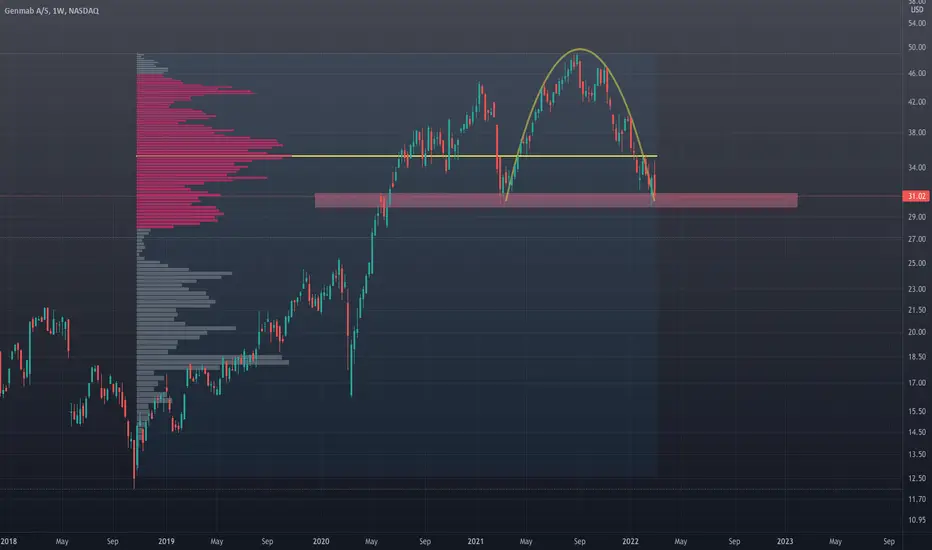
Inverse Cup and handle on the weekly $GMABInverse Cup and handle on the weekly $GMAB
- Inverse Cup and handle on the weekly
- VPVR acting as resistance
- Waiting for a trigger
$ANF Double tops with bearish flag forming ! $ANF Double tops with bearish flag forming !
- Double tops on the weekly
- Perfect entry on the bear flag

One ETF where you can short both EVs and Semis $IDRVOne ETF where you can short both EV and Semi $IDRV
- Overcrowded
- Trigger below $43 and waiting for a good set up formation

Bearish Crab at the PCZ with divergenceBearish Crab at the PCZ with MACD bearish Divergence and showing a lower high and lower low locally also coming off of overbought on the RSI

BTCUS Short, Optional re-entry, golden ratio count, AB=CD, CrabBTCUSD Optional re-entry, golden ratio count, AB=CD, Crab
Hi trader. As you can see on this roadmap of BTCUSD we have strongs confluences which efforts a speculative montly target based on Gartley AB=CD and others Fibonacci's golden ratio correlations. I'm pointing in a counting of timeframe a probably re-entry for a better short position. A Bump and Run (BARR) effect can be developed in a potential downward continuation as well a micro Head and Shoulders formation. A swing daily target can be expected at 88.6% of Fibonacci Retracement. We are in a PRZ area of a Crab harmonic pattern terminated in the upthrust peak. The daily condition is bearish but in the next hours the price action can elevate above 44.3k, as a H&S’ neckline retest. Some wyckoff’s fundamentals are displayed in balllons.
Technical indicators
- Awesome Oscillator - bearish condition for the next hours and strong bearish divergence;
- Fisher Transform - potential micro bullish (small retrace) momentum in a macro downward;
- Ehler’s Smoothed Stochastic RSI - daily bearish, H4 in a potential retrace.
Candlestick’s price action strongly bearish in a bearish engulfing formation. That’s a good point to scalp in short.
All informations displayed here and on the chart are for educational use only.


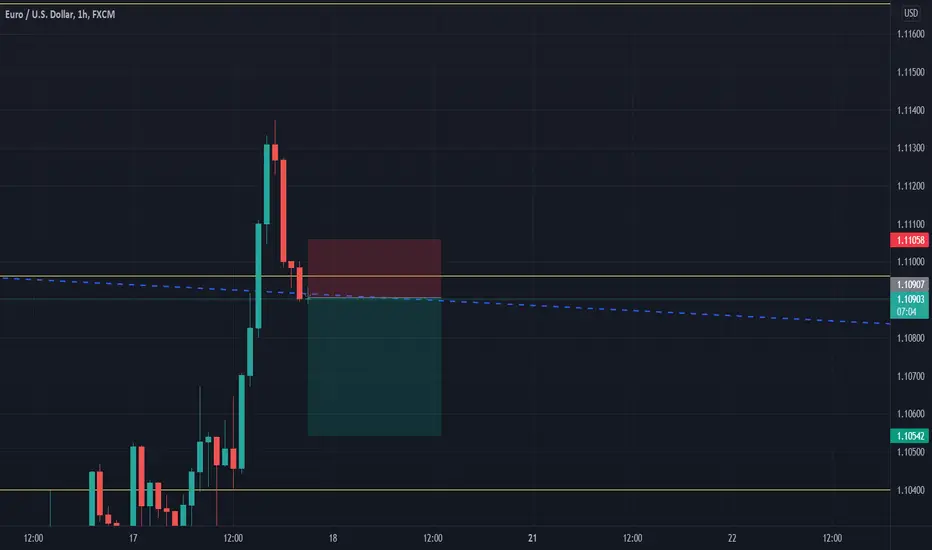
NZDUSD SHORT POSITIONThe price has broken the channel in the daily time and pulled it back. So in the down time we look for sales opportunities. In 1 hour time, the uptrend line is broken. We expect a 50% Fibonacci price correction to the supply zone. After that and seeing a downward confirmation candle, we enter the sell deal.

SHORT POSITION and Fibonacci Retracement JournayHi traders. I'm showing to you a fibonacci retracement strategy perspective w/ the 14.6% level as a good average point to take profits. The evening star at 2-day TF is a highly persuasive short signal in confluence w/ the daily overbought condition. The evening star candle makes the E-point of a triangle structure that is located at daily supply zone (100-88.6% fibonacci retracement). A 2-phase downward 50-14.6% in a 2-3-day swing is a obvious scenario to spect. This annalysis is based on daily price action too. An leveraged token like DOTDOWN can be a good choice to avoid the liquidation risky. Good day trade to us!
2-DAY SWING DOWNWARD AHEAD
FROM 2H-EVENING STAR IN SUPLY ZONE
DOWNTREND CONTINUATION
E-POINT OF TRIANGLE STRUCTURE
OVERBOUGHT DAILY STOCHASTIC
50% FIBO RETRACEMENT TP1
14.6% FIBO RETRACEMENT TP2
33K DEMAND RETEST SPECTED
WEEKLY BEARISH

GBPJPY 4h timeframe shortsGBPJPY 4h timeframe swing trade short position, long term trade buy decent RRR.
