USDCADLooking Ahead: USD/CAD Forecast for the Coming Years
When analyzing the future outlook of USD/CAD over the next few years, several key factors come into play, including economic policies, commodity prices, and overall market sentiment.
Shortsetup

$SPOT the overvalued stock..Be real.. I’m an Apple Music/ Apple applications guy. This stock just seems a little too bloated for me. I’d like to see a retrace to that gap up, this market is volatile and this thing can move hardbody either direction. I’d take my chances with a short for about 50 days out, $560 is the target. I got a bearish rising wedge forming possibly here and some FIB retrace and Elliot Waves. Very expensive premiums as well. Have fun.
WsL

THE ROAD TO 68K BTC.P/USDT 4 HOUR In this idea I expand upon my previous idea posted in December on the 8th. The previous idea showed the rudimentary course we would take according to the formation set of Ascending scallops.
In this chart I outline the key supports, resistance, and the projected bottom point we will bounce from to head back up.
Seems we have fallen from a large scale rising wedge and are now inside of descending broadening wedge. This is all in line with my previous idea and is moving as expected. We do not have long to go before we reach our bottom target if we do in fact move as projected.
Only time will tell, Happy Hunting - TND

CADCHF SHORTWe are in consolidation we touch upper band and we brake 4h trend + trend line. that is signal that market can go down.
My expextation are that we are going to lowr band of consolidation.
At that point i will look for long oportunities.

Gold short term recovery - downtrend⭐️Smart investment, Strong finance
⭐️GOLDEN INFORMATION:
Gold prices (XAU/USD) start the week on a strong footing, rebounding further from Friday’s three-week low near $2,833–2,832. Despite US inflation data aligning with expectations, traders remain confident that the Federal Reserve will implement two quarter-point rate cuts by year-end. Additionally, renewed selling pressure on the US Dollar supports the appeal of the non-yielding yellow metal.
⭐️Personal comments NOVA:
Gold price recovers in short term, sellers are dominating, retesting liquidity zone 2883
⭐️SET UP GOLD PRICE:
🔥 BUY GOLD zone: $2832 - $2834 SL $2827
TP1: $2840
TP2: $2850
TP3: $2960
🔥 SELL GOLD zone: $2883 - $2885 SL $2890
TP1: $2875
TP2: $2868
TP3: $2860
⭐️Technical analysis:
Based on technical indicators EMA 34, EMA89 and support resistance areas to set up a reasonable SELL order.
⭐️NOTE:
Note: Nova wishes traders to manage their capital well
- take the number of lots that match your capital
- Takeprofit equal to 4-6% of capital account
- Stoplose equal to 2-3% of capital account

Gold📌 **Sell:**
✔ In short-term timeframes (M1, M5, M15), both MACD and Stochastic indicate overbought conditions and a potential downward correction.
✔ The M30 timeframe is still in an uptrend, but a pullback to the downside is possible.
🎯 **Conclusion:**
Success rate for selling: ✅ **70%** (more reliable than buying in the short term).
📌 **Strategy:** Short-term selling with a tight stop-loss and a corrective target towards lower support levels.
📌 **Buy:**
✔ In H1 and H4 timeframes, signs of a trend reversal are emerging, but MACD has not yet given a solid confirmation.
✔ If MACD turns bullish on H1 and Stochastic exits oversold territory, buying will be a safer option.
🎯 **Conclusion:**
Success rate for buying: ✅ **55%** (higher risk, requiring more confirmation).
📌 **Strategy:** Wait for MACD confirmation on H1, then enter a buy position upon resistance breakout.
🚀 **Final Recommendation:**
🔹 Enter short-term sell positions in lower timeframes with a tight stop-loss and proper risk management.
🔹 Wait for a confirmed buy signal on H1 and H4, as MACD has not yet turned fully bullish.
🚀 **Short-term selling (scalping) is more probable**, but additional confirmation is needed for a buy position.
### **Suggested Targets Based on Timeframes & MACD + Stochastic Analysis**
🔴 📉 **Sell Targets:**
Considering overbought conditions in lower timeframes and a potential downward correction, the best sell targets based on different timeframes are:
✅ 📌 **First Target:** 2850 (Short-term support in M5 & M15)
✅ 📌 **Second Target:** 2842 (Key support in M30)
✅ 📌 **Third Target:** 2830 - 2825 (Strong support in H1, aligning with the moving average)
🛑 **Stop Loss for Sell Positions:**
🔹 **2862** (Breakout of the current resistance in M15 & M30)
🔹 **2868** (If the price reaches this level, the trend may reverse)
---
🟢 📈 **Buy Targets:**
A **full confirmation from MACD in H1 and H4** is required for a buy setup. However, if the price rebounds from the **2830 support zone**, the following targets are expected:
✅ 📌 **First Target:** 2865 (Initial resistance in H1)
✅ 📌 **Second Target:** 2880 - 2890 (Strong resistance zone in H4)
✅ 📌 **Third Target:** 2915 (Long-term target if resistance levels are broken)
🛑 **Stop Loss for Buy Positions:**
🔹 **2825** (If this level is broken, the downtrend is likely to continue)
🚀 **Suggested Strategy:**
📌 **Short-term sell (scalping) from 2857**, targeting **2850 and 2842**, with a **stop loss at 2862**.
📌 **Buy if confirmed at 2830 - 2825**, targeting **2865 and 2880**, with a **stop loss at 2825**.
🔍 **Important:** Before entering positions, confirm with **trading volume and candlestick patterns in higher timeframes**. 🚀

GBP/USD SHORTThis analysis is based on the provided image and should not be considered financial advice. Trading involves risks, and it is essential to conduct your own research and consult with a financial advisor before making any trading decisions.

Downward momentum, downtrend next week, XAU ✍️ NOVA hello everyone, Let's comment on gold price next week from 03/3/2025 - 03/07/2025
🔥 World situation:
US President Donald Trump confirmed that 25% tariffs on Mexican and Canadian goods will take effect next week on March 4. Meanwhile, the Fed’s preferred inflation gauge, the Core PCE Price Index, signaled continued progress toward the central bank’s 2% target.
Following the data, expectations for further Fed policy easing grew. According to Prime Market Terminal, the Fed is anticipated to cut rates by 70 basis points this year, with investors betting on the first reduction in June.
🔥 Identify:
Breaking the trend, gold continues to maintain a downtrend
🔥 Technically:
Based on the resistance and support areas of the gold price according to the H4 frame, NOVA identifies the important key areas as follows:
Resistance: $2876, $2903, $2956
Support : $2810, $2773
🔥 NOTE:
Note: Nova wishes traders to manage their capital well
- take the number of lots that match your capital
- Takeprofit equal to 4-6% of capital account
- Stoplose equal to 2-3% of capital account
- The winner is the one who sticks with the market the longest

BTC - Bigger Picture of Liquidity Collection RoadmapExpanding on my last idea focusing on the first move in this sequence, here is a bigger picture of this idea and I will explain in detail how I arrive to this.
1. The market is always going to absorb liquidity.
We know this. We also know that since Dec 2022 Bitcoin has been on a steady climb up allowing for lots of long positions to open and stay open. What this creates is a lot of absorbable liquidity in the form of long position stop losses. Further more, the dominance of leverage is very high in crypto, therefor these stop loss orders are “leveraged sell orders”. This is the “fuel” that can be used to explain the possibility of a move of this magnitude.
In other words, the orders are already in place in the chart; the adverse of traders decisions via leveraged position stop losses.
2. We can identify (2) main trendlines that explains why Bitcoin has been struggling so much around these zones. Price tends to break above and below these diagonal trendlines, trading sideways in a diagonal fashion - until there is enough “fear” or justification to allow the trendline to play itself out.
The first trendline I design for you in my previous idea. This takes Bitcoin to a zone with several confluences. (1) A Volume Profile support, (2) The bottom of a bearish trendline, and (3) The absorption of a mass amount of liquidity located from the current price to that zone.
The second trendline, which you can apply the same validation methods I pointed out in my previous idea (duplicating the trendline and placing it infinitely at different areas on the chart and observing price respecting the angle), has a bottom of $7,000.
Now this Uber low may seem extraordinarily unrealistic, but there is again, a mass amount of liquidity located in those low zones that the market wants to absorb.
3. I lay out here a corrective wave sequence that would allow all of this liquidity to be absorbed.
The US Dollar on the higher timeframes shows a bearish retest of a major breakdown. With all of the negative news and geopolitical tension with the US, both technically and fundamentally this points in the direction of a falling US dollar relative to other global currencies.
4. Ultimately this is good for Bitcoin.
I present this idea for several reasons, most importantly, what I can see happening (assuming this does occur) is that many holders and investors will sell at very low prices in extreme fear that Bitcoin will go to zero, when in fact it would just be a liquidity grab prior to a true 3-5 year bull run on Bitcoin as the US Dollar loses strength.
Of course being ill prepared and selling at those extreme lows would be catastrophic for investors and traders.
So if anything, I hope this serves you with the possibility explained in detail, and in the event you see this occur, to not panic and not sell. To do the exact opposite of what the majority would do and BUY into those extreme fear zones.
Happy trading and stay safe.
For anyone wanting to argue that it’s not possible or showing their confidence that it would never happen; please understand there is no harm is looking at potential scenarios and this isn’t an ego contest about who is right or wrong. It’s ideally about looking out for each other and sharing our work, knowledge, and experience to collectively succeed in understanding this challenging market.
People may also like to point out that I’ve been speaking about this occurring for roughly a year, and have been wrong - however the timing of such events doesn’t mean it’s “wrong”. If the chart demonstrates a possibility, it remains.

EURUSD Potential Short Setup - 1HR Swing TradeThis trading idea proposes a short position in EURUSD on the 1-hour timeframe, based on the expectation of a continued downward move. The entry point is strategically located at a resistance level, with a stop-loss order to manage risk and a take-profit target set at a potential support zone.
Disclaimer :
This analysis is based on the provided image and should not be considered financial advice. Trading involves risks, and it is essential to conduct your own research and consult with a financial advisor before making any trading decisions.

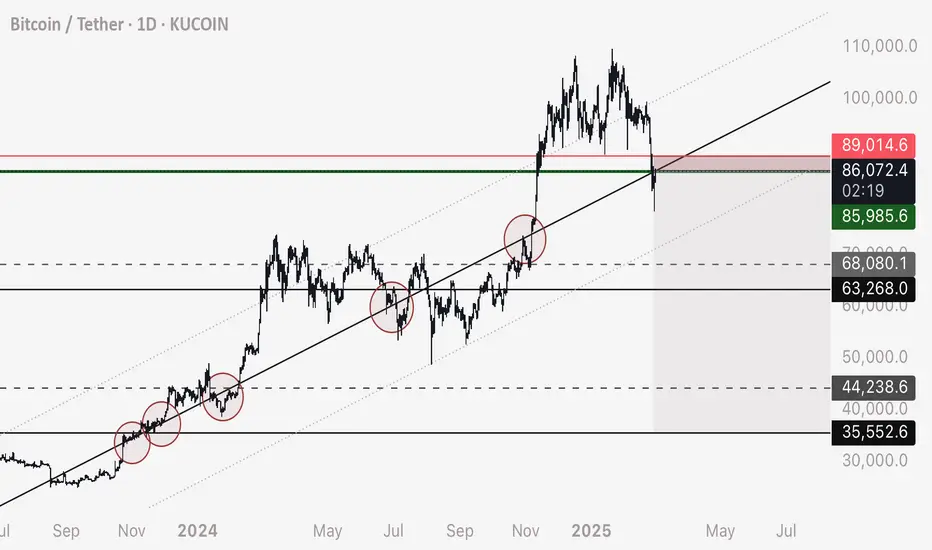
BTC - Watch this Trendline - Potential Short to 36,000I’ve drawn the main trendline and marked the contact points in red circles if you’d like to replicate this on your own chart
I’ve also demonstrated that when the correct trendline is identified, it can be duplicated and placed at different points on the chart that price seems to follow - IE support / resistance works on a diagonal grid
I’ve marked my personal entry in green, stop loss in red - minor targets in grey dashed lines and major targets in black solid lines
Fundamentally this drop makes sense as there is a mass amount of liquidity in these below zones.
Not financial advice, do your own research and experimentations.
God speed!
GBPJPY trend continuation?Next week, we can expect the continuation of the trend. The technical analysis is fully explained in the chart, but what needs to be watched are the fundamental reports:
Manufacturing PMI on Monday, (impulsive move)
Tuesday nothing (correction move)
Services PMI on Wednesday, (impulsive move)
Jobless Claims on Thursday, (impulsive move)
and NFP along with Fed Chair Powell's speech on Friday. (impulsive move)
We expecting high volatility during news events. Trade what you see, not what you think.

trend towards 2845, trend continues to strengthen! gold ⭐️ Smart investment, Strong finance
⭐️ GOLDEN INFORMATION:
Gold price (XAU/USD) declines for the second consecutive day, hitting a two-week low around $2,860 during Friday's Asian session. The US Dollar (USD) continues its recovery for the third straight day, supported by expectations that the Federal Reserve (Fed) will maintain its hawkish stance due to persistent inflation. This strengthens the USD and weighs on the non-yielding gold.
⭐️ Personal comments NOVA:
The gold price adjustment is mandatory, along with the influence of the world financial sectors, selling off at the same time. The trade war is very close, gold is also negatively affected by investors.
⭐️ SET UP GOLD PRICE:
🔥 SELL GOLD zone: $2891 - $2893 SL $2898
TP1: $2885
TP2: $2878
TP3: $2870
🔥 BUY GOLD zone: $2846 - $2844 SL $2839
TP1: $2852
TP2: $2860
TP3: $2870
⭐️ Technical analysis:
Based on technical indicators EMA 34, EMA89 and support resistance areas to set up a reasonable SELL order.
⭐️ NOTE :
Note: Nova wishes traders to manage their capital well
- take the number of lots that match your capital
- Takeprofit equal to 4-6% of capital account
- Stoplose equal to 2-3% of capital account

#TRUMPUSDT – Bearish Scenario, Breakout Down📉 SHORT BYBIT:TRUMPUSDT.P from $12.278
🛡 Stop Loss: $12.599
⏱ 1H Timeframe
⚡ Trade Plan:
✅ The BYBIT:TRUMPUSDT.P price has formed a Bearish Flag and broke its lower boundary, confirming a bearish scenario.
✅ The asset is trading below POC (Point of Control) at $12.978, indicating strong seller dominance.
✅ Increasing volume on the breakdown further confirms the strength of the downward move.
🎯 TP Targets:
💎 TP 1: $12.100
🔥 TP 2: $11.900
⚡ TP 3: $11.785
📢 A close below $12.278 would confirm further downside movement.
📢 POC at $12.978 is a strong resistance level that the price failed to break.
📢 Increasing volume on the drop supports the bearish outlook.
📢 Securing partial profits at TP1 ($12.100) is a smart risk-management strategy.
🚨 BYBIT:TRUMPUSDT.P remains in a downtrend – monitoring for continuation and securing profits at TP levels!

EUR/USD Bearish Trigger: 1.0400 Break Targets 1.0323 & 1.0270
EUR/USD is hovering around the 1.0400 support—a key level also marking the lower boundary of its recent flat zone. A definitive break below this threshold could trigger a downside continuation, exposing Expect Level 1 (1.0323) and potentially Expect Level 2 (1.0270). Strong resistance near 1.0530 remains intact, reinforcing the bearish bias. As long as price remains below the broken trendline and fails to reclaim the flat-zone highs, sellers appear poised to drive the pair toward these lower Fibonacci-based targets.

$CRM short setup part two. $280 target.Check out my recent post on $CRM. This name is down from it’s highs already 11% or so but 20% is correction territory so I can see this name hitting $280 area. $280-$285. Multi day put swing.
WSL

$CRM lower guidance, weak numbers, AI poopieNYSE:CRM should see sell pressure into the $285 zone and if it doesn’t hold expect $270’s.
WSL

#TAIUSDT – Bearish Scenario, Expecting a Downward Breakout📉 SHORT BYBIT:TAIUSDT.P from $0.11880
🛡 Stop Loss: $0.12155
⏱ 15M Timeframe
⚡ Trade Plan:
✅ The BYBIT:TAIUSDT.P price is in a downtrend, continuing to decline after testing the POC (Point of Control) at $0.13002.
✅ The asset is currently near the $0.11887–$0.12155 support zone, and a breakdown could trigger further selling pressure.
🎯 TP Targets:
💎 TP 1: $0.11550
🔥 TP 2: $0.11305
📢 A close below $0.11880 would confirm the downward move.
📢 POC at $0.13002 acted as a major resistance where buyers were active.
📢 Increasing volume on the decline supports the bearish momentum.
📢 The first TP at $0.11550 is a level where partial profit-taking is recommended.
🚨 BYBIT:TAIUSDT.P remains under pressure – monitoring for a confirmed breakdown and securing profits at TP levels.

continue to decrease, return to price zone 2904⭐️ Smart investment, Strong finance
⭐️ GOLDEN INFORMATION:
US consumer confidence saw its biggest drop since August 2021, falling to 98.3 in February from 105.3, according to the Conference Board.
Richmond Fed President Thomas Barkin said on Tuesday that he favors a wait-and-see approach on interest rates until there is clear evidence that inflation is returning to the Fed’s 2% target.
Meanwhile, Dallas Fed President Lorie Logan suggested that, over time, the Fed should prioritize purchasing shorter-term securities to better align its portfolio with Treasury issuance, as reported by Bloomberg.
⭐️ Personal comments NOVA:
Still a downtrend today, back to the price range of 2900, 2890 to accumulate the uptrend
⭐️ SET UP GOLD PRICE:
🔥 BUY GOLD zone: $2905 - $2903 SL $2900 scalping
TP1: $2908
TP2: $2912
TP3: $2920
🔥 BUY GOLD zone: $2889 - $2887 SL $2882
TP1: $2895
TP2: $2903
TP3: $2910
🔥 SELL GOLD zone: $2946 - $2948 SL $2953
TP1: $2940
TP2: $2930
TP3: $2920
⭐️ Technical analysis:
Based on technical indicators EMA 34, EMA89 and support resistance areas to set up a reasonable SELL order.
⭐️ NOTE :
Note: Nova wishes traders to manage their capital well
- take the number of lots that match your capital
- Takeprofit equal to 4-6% of capital account
- Stoplose equal to 2-3% of capital account

BTC pre-Trump GAP zone returnBTC saw pre-Trump pump in Nov 2024, return to this zone is the most probable scenario I see now.

Whats next after the Bitcoin correction In this video I Breakdown a couple of potential Targets for longs .

Scalping ! XAU ! wait for price recovery at SELL entry 2947⭐️ Smart investment, Strong finance
⭐️ GOLDEN INFORMATION:
Chicago Fed President Austan Goolsbee emphasized on Monday that the central bank will adopt a cautious approach, waiting for more clarity before considering rate cuts.
Meanwhile, the World Gold Council (WGC) reported that gold-backed ETFs saw their biggest weekly inflow since March 2022.
Traders now focus on upcoming US data, including the Conference Board's Consumer Confidence Index and the Richmond Manufacturing Index, along with speeches from Fed officials, which could impact the USD.
⭐️ Personal comments NOVA:
Accumulated price zone according to H1 trendline, continue sideways waiting for tariff momentum to reach 3000
⭐️ SET UP GOLD PRICE:
🔥 SELL GOLD zone: $2947 - $2949 SL $2952
TP1: $2943
TP2: $2938
TP3: $2930
⭐️ Technical analysis:
Based on technical indicators EMA 34, EMA89 and support resistance areas to set up a reasonable SELL order.
⭐️ NOTE:
Note: Nova wishes traders to manage their capital well
- take the number of lots that match your capital
- Takeprofit equal to 4-6% of capital account
- Stoplose equal to 2-3% of capital account

How to find Sell Side Institution Trading ActivitySell Side Institutions are a major market participant. They are often called "Wall Street"
These giant banks and financial services companies do a variety of trading activities. They move price in an entirely different way than the Buy Side Institutions.
Sell Side Institutions have specific services they provide to the stock market including Market Making when there is a void of buyers. Sell Side make the market by selling short before market opens when the overall market has more retail sellers than buyers.
Sell Side also does all the buybacks for major corporations. Sell Side also are strictly short term trading trading a variety styles and strategies throughout the day. Sell Side has the best of the best floor traders who are the most experienced and savvy traders in the world.
Join this discussion to find you how you can learn to trade with the Sell Side and what indicators to use in your Tradingview software.
