Gold liquidity run short setup Update 2This video is an update on the Gold setup that was posted on the 4/06/25
I cover the price action and discuss what I think will be occurring from this point onwards as
part of the original trading plan .
Shortsetup

BTC Under Major Resistance HereBitcoin has shown strength towards playing out these ideas, as unrealistic as it may seem.
The interactions at specific levels have shown these trendlines to be valid.
I see two scenarios if BTC holds below its resistance at 104,550 to 105,000
104,600 to 35,000
35,000 retrace to 75,000
75,000 to 7,000
Alternatively:
104,600 to 20,000
Up from 20,000
While these seem like macro projections, per my previous posts and explanations - it’s possible to see this occur in a very small period of time. IE flash crash, stop hunt, etc.
Happy trading.

Tesla Update Longs and shorts At the start of the video I recap my previous video and then bring us up to date with the present price action .
In this video I cover Tesla from the higher time frame and breakdown both a long term bullish scenario as well as a local bearish scenario .
Both of these scenarios present longs and short entries for day trade opportunities and swing positions .
Tools used Fibs , TR pocket , Volume profile , Pivots , and vwap .
Any questions ask in the comments
Safe trading and Good luck

BTC PATo me it seems that the BTC chart is printing a traditional head and shoulders pattern, which would indicate probable lows at least in the short term.

Short trade BTC/USD to 105k A retest of a crucial support is currently underway. If the support cannot be broken expect bitcoin to retest 105,000k and then retest the crucial support once again at 103,000k. If the support is broken we will drop to a range of 99,600k to 101,600k.
Entry 103,100
TP1 104,000
TP2 105,000
SL 102,750

SHORT ON US30US30 Has given us a change of character to the downside with a nice retest creating a lower high.
I will be selling us30 to the next demand zone looking to catch 500-1000 points.

EURUSD Analysis | Potential Breakdown AheadHello Traders
The pair has been respecting a rising parallel channel after breaking out from a consolidation zone earlier this month.
🔹 Current Price: 1.1409
🔹 Trend: Uptrend within a rising channel
🔹 Key Observation: Price is testing the upper range but showing signs of weakness.
🔍 Technical Breakdown:
Price recently failed to make a new high, showing signs of exhaustion.
A break below the channel support could trigger a sharp move downward.
Two strong support levels are in focus:
1.12308 (short-term target)
1.10812 (major target)
📉 Bearish Scenario:
If we get a confirmed break below the channel, I’ll be looking for short opportunities with the first target at 1.1230, and if momentum continues, down to 1.1080.
⚠ Watch for rejection candles or a strong bearish close below the channel support to confirm the move.
💬 What’s your bias on EUR/USD? Are you trading this potential setup?
#EURUSD #Forex #TechnicalAnalysis #PriceAction #TradingView #ChartAnalysis

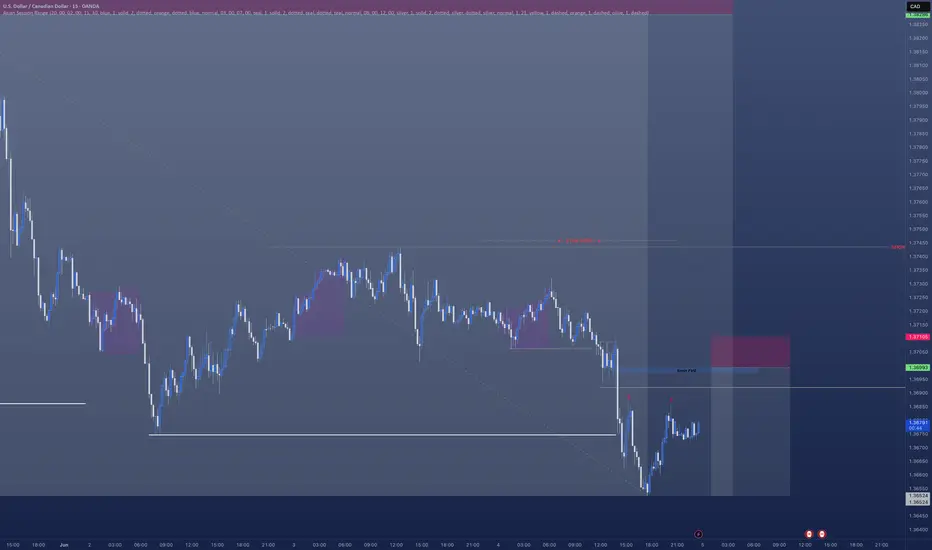
USDCAD - Short ContinuationHave a really nice short currently open on USDCAD
However I am looking to get a further position opened which come in the morning.
There's a clear break of structure.
- A nice FVG left behind.
- We are creating liquidity / inducement
- All pointing towards a nice further sell off in the morning.
Ideal situation is we sweep Asian session highs in the morning in the hope we move lower
A crash in the horizonAs I have been suspecting for a long time. Markets are getting closer to a crash. On the weekly the 2 years bond market confirmed the change in the trend to the downside. Once we dip bellow the blue ema we might be entering in a doomed phase. Cheers

TECHNICAL APPROACH - USDCAD SHORT FORECAST Q2 W23 D23 Y25🔥👀USDCAD SHORT FORECAST Q2 W23 D23 Y25
TECHNICAL HOTPICK ! 💥💥
Professional Risk Managers👋
Welcome back to another FRGNT chart update📈
Diving into some Forex setups using predominantly higher time frame order blocks alongside confirmation breaks of structure.
💡Here are some trade confluences📝
✅4H order block rejection
✅HTF 50 EMA
✅Intraday bearish breaks of structure to be identified
✅15’ order block identified
🔑 Remember, to participate in trading comes always with a degree of risk, therefore as professional risk managers it remains vital that we stick to our risk management plan as well as our trading strategies.
📈The rest, we leave to the balance of probabilities.
💡Fail to plan. Plan to fail.
🏆It has always been that simple.
❤️Good luck with your trading journey, I shall see you at the very top.
🎯Trade consistent, FRGNT X

$UNH contrarian idea ..Hello, this seems to be the "BUY THE DIP!" name definitely on the retail side. A guy once told me, if everyone is talking about getting into something, buying something, it might be a good time to sell and get out of that something. Example: I have been buying Bitcoin for five years, the price has risen and now everybody is talking about Bitcoin, that might be a clear indicator to sell some of that position and take profits; contrarian. So, something is telling me this name isn't ready to just ride to the upside like everybody is imagining. A big zone is down around $200, a 7 year demand. This name is in turmoil, randomness happens. I believe the name would have kept going down if the insider buy did not come in and bring some momentum. I can see this name retracing back to $275 and below. Will be interesting to see. On watch is $275p 6/20.
WSL

$HOOD great product but short term pull back here $58-$60Hello, I have multiple time frames up here: Daily, Weekly, and Monthly. I love Robinhood NASDAQ:HOOD as a broker, product and revolutionary company in the financial space. This is a great long term hold equity wise in my opinion but right now I am looking to short this name for a necessary pullback into $58-$60. It's overbought on the big time frames as you can see highlighted, it is possible it can break out of course but I believe with declining weekly volume this name will resort to some pullback. Also, Bitcoin can have some downside as well which will bring this name down with it. This ticker is volatile and can move 5-8% in either direction in just one session. I am looking for $60p about 3 weeks out, 6/20 date.
WSL

Nasdaq Signals Economic Instability – Are You Watching CloselyDear traders,
You may be witnessing a “first” — a pivotal moment right before things begin to spiral.
We’re not fortune tellers. We don’t claim to predict the future.
But what you’re about to read is based entirely on publicly available data, interpreted not through speculation, but through a deep, rational analysis of interconnected facts — the kind of connections that most overlook, and few dare to question.
We may not know how the future is being orchestrated behind the scenes...
But one thing seems certain: crisis always comes first... and then we are given a narrative to justify it — be it war, a pandemic, or a "global emergency."
This is the correct sequence... and it’s the one they never teach you.
Yet for those of us who navigate the financial markets, one question matters more than all others:
How do we profit from this?
We recently shared an important setup on the Nasdaq index, the benchmark that reflects — to a large extent — the true state of the U.S. economy.
As a proxy for the 100 largest American corporations, the Nasdaq plays a critical role in signaling macro trends.
And while some are just now waking up to the storm ahead, our outlook has been clear since October 2022:
A major economic crisis was not only probable… it was inevitable.
Some analysts chalk this up to uncontrolled money printing post-2019 as governments tried to patch the damage from the COVID-19 crisis. That’s one explanation.
But at Glich, our vision is different.
More complex.
And for now… not something we can fully release.
For years, strong correlations between risk markets — especially U.S. equities and crypto — held firmly in place.
But something changed on May 30th, 2025. Completely and unmistakably.
The link was severed.
Now ask yourself:
Why was Bitcoin created in the first place?
It wasn’t just digital money.
It was a bold, revolutionary idea. A system designed for a future economy no longer shackled by inflation, central banking failures, or hidden agendas.
A fluid, transparent, and secure network for a world in desperate need of change.
The current financial model is obsolete. It’s no longer evolving — just surviving.
And it can no longer answer the challenges of what's to come.
2008 was not the collapse; it was the setup. A convenient pretext to slowly roll out something new.
And "Satoshi Nakamoto"? Well, let’s just say...
That name means more than you think.
"HIDDEN INFORMATION" 👁️
What does NEO mean when he says:
"This has all happened before… yet it’s happening for the first time"?
And what does that have to do with us?
This analysis is not just about charts or setups.
It’s a hidden message — a spotlight on a once-in-a-generation opportunity lying in plain sight.
But not everyone is trained to read between the lines.
Let us ask:
Why was Donald Trump specifically pushed into position?
Why is crypto — after being suppressed, banned and attacked worldwide — now being quietly promoted and fast-tracked in legislation during 2024 and 2025?
Something’s moving beneath the surface.
🔍 In summary:
Expect a tidal wave of global crypto legislation to pass in the coming days/weeks/months.
Crypto — particularly BTC and ETH — will become silent stores of value during the economic storm.
Expect record-breaking levels:
400
K
f
o
r
B
i
t
c
o
i
n
∗
∗
,
∗
∗
400KforBitcoin∗∗,∗∗40K for Ethereum.
Yes, this may sound like science fiction…
But keep your eyes and ears wide open. 👁️
And brace yourself for a historic collapse in U.S. equities. Possibly… something we’ve never seen before.
The show is starting.
And we won’t spoil the ending — because watching it unfold is part of the experience.
But here’s what we can say, thanks to our proprietary algorithmic system:
The U.S. economy will bleed.
And crypto will blow past expectations — fulfilling the very purpose it was built for.
🛒 Load your bags in the coming days...
Because when this train leaves the station —
It won't be stopping for anyone.

Link, 1DAs BTC is Falling And BTC is given Breakout of Pattern in 4Hr , then Remaining coins will also fall drastically .
in 1D pattern of ADA USDT , it is Breaking Down as BTC is also given Break Down of Pattern
Follow for More Ideas like This

XLM ,1DAs BTC is Falling And BTC is given Breakout of Pattern in 4Hr , then Remaining coins will also fall drastically .
in 1D pattern of XLMUSDT , it is Breaking Down as BTC is also given Break Down of Pattern
Follow for More Ideas like This

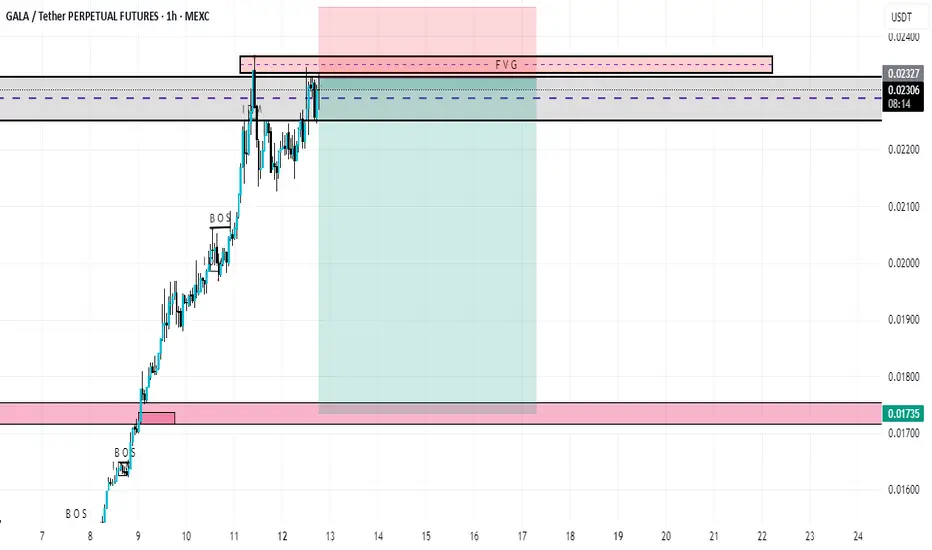
gala short tradegala is on 4hr bearish orderblock and no w going to retrace the HTF (POI) daily advanced order block at 0.01735
trade short
entry 0.02333
target 0.01735
stop loss 0.02460
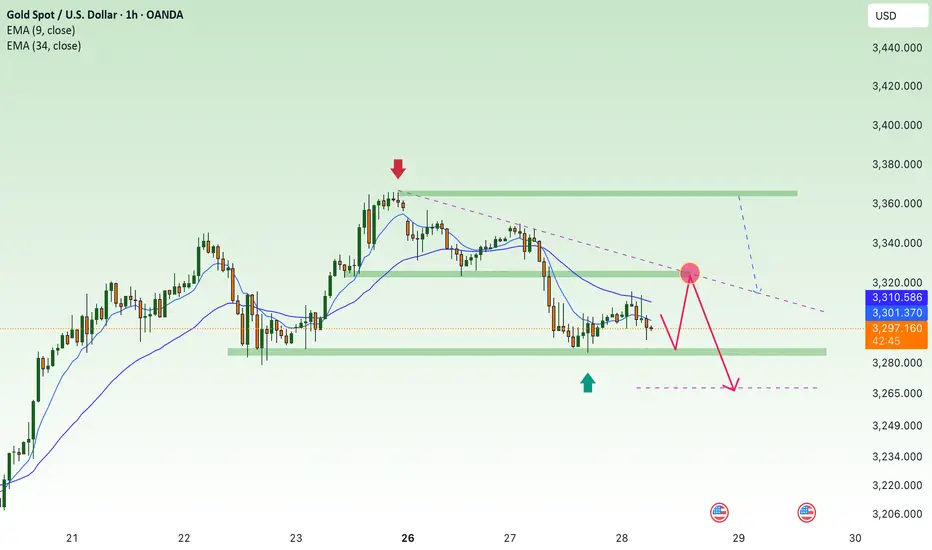
Selling pressure, gold price falls below 3300⭐️GOLDEN INFORMATION:
Gold prices continued to retreat during Wednesday’s North American session, slipping below the $3,300 mark after reaching an intraday high of $3,325 earlier. The pullback, amounting to a 0.27% decline, came as traders absorbed the implications of the latest Federal Reserve (Fed) meeting minutes.
During the May 6–7 policy meeting, the Fed opted to leave interest rates unchanged, highlighting growing uncertainty surrounding the economic impact of proposed tariffs. Officials maintained a cautious stance, citing heightened risks of both inflation and unemployment—potential consequences of trade disruptions.
The minutes also reflected concerns over stagflation, with policymakers noting that “the Committee may face challenging trade-offs if inflation proves more persistent while growth and employment expectations deteriorate.”
⭐️Personal comments NOVA:
The downtrend line remains intact, gold prices are trading around below 3300. The tariff backdrop remains largely unchanged.
⭐️SET UP GOLD PRICE:
🔥SELL GOLD zone : 3311- 3313 SL 3318
TP1: $3300
TP2: $3290
TP3: $3280
🔥BUY GOLD zone: $3205- $3207 SL $3200
TP1: $3218
TP2: $3230
TP3: $3248
⭐️Technical analysis:
Based on technical indicators EMA 34, EMA89 and support resistance areas to set up a reasonable SELL order.
⭐️NOTE:
Note: Nova wishes traders to manage their capital well
- take the number of lots that match your capital
- Takeprofit equal to 4-6% of capital account
- Stoplose equal to 2-3% of capital account

my prediction is on bitcoin downward correction is onprevious post i told you guys bitcon need a downward correction. now see the results already its' going down.
EURAUD - Technical analysisHello dear traders! Welcome to this trading idea...
First, we have a few trading options here.
1. We can open short right now, with a small target profit at the previous resistance level...
2. Wait until the price tests our resistance level and sell or buy only after that.
3. Shorting position after the price comes down, an uprising diagonal (green) line, and will break down our marked red line price marking level.
In this situation, what we are waiting for is a selling opportunity. SELL
But... If the pair becomes bullish, we may go long later.

BTC Trap & Reverse: The Power of SFPs in ActionBTC continues to chop in a tight range near its previous all-time high. While price action may appear messy at first glance, traders using a combination of structure, Fibonacci levels, and order flow tools are spotting clean opportunities — especially through Swing Failure Patterns (SFPs).
🔍 What Just Happened?
Bitcoin recently rejected from the 0.786 Fibonacci retracement level — a classic reaction zone. What made this move powerful was the SFP that formed at that level. Price swept above a prior high, triggering breakout buys, only to reverse. This type of move traps late longs and offers an ideal short entry.
🧠 Educational Insight: Why SFPs Are One of the Best Setups
SFPs (Swing Failure Patterns) are some of the highest-probability trades you can take for a few key reasons:
1️⃣ Liquidity-driven: They form where stop losses cluster — above highs or below lows — creating a magnet for price.
2️⃣ Clean invalidation: The wick high/low gives a natural stop-loss level, keeping risk tight.
3️⃣ Fast reaction: Once trapped traders are forced to exit, price often reverses sharply — giving you strong follow-through.
4️⃣ Confirmable with order flow: Using tools like Exocharts, you can see aggressive longs/shorts piling in just before the reversal. This adds conviction to the setup.
📏 Current Confluence:
Rejection from the 0.786 Fib retracement
SFP confirmed on high volume
1:1 trend-based Fib extension sits at ~$105,410
That level also lines up with the 0.666 Fib retracement
Anchored VWAP around $105K
Liquidity pool right at that zone too — a likely magnet
🎯 Trade Idea:
Short triggered at the SFP wick, stop just above it. First target: the 1:1 extension near $105.4K. Risk-reward is excellent with high probability if price continues to unwind late longs.
✅ Key Takeaway:
In ranges like this, you don’t need to guess direction — you need to react to structure. SFPs give you that edge. When paired with real-time tools like Exocharts and anchored VWAPs, these trades become sniper entries rather than coin flips.
Let the market show its hand — and trade the reaction, not the prediction.
📌 Summary:
This is how you avoid overtrading in chop: wait for key levels, watch how price reacts, and let trapped traders create the move. If BTC revisits the $105K region, it’s a major area to watch for reaction — or to take partials if you’re in a short.
The best trades come from patience + precision.
_________________________________
If you found this helpful, leave a like and comment below! Got requests for the next technical analysis? Let me know.

Selling pressure, gold price continues to fall below 3285?⭐️GOLDEN INFORMATION:
Gold prices declined by nearly 2% on Monday, slipping below the $3,300 mark, as investor sentiment improved following U.S. President Donald Trump’s decision to postpone tariffs on European Union imports. The renewed risk appetite, coupled with a modest rebound in the U.S. Dollar from last week’s losses, placed pressure on the non-yielding precious metal.
The move came after a weekend call between President Trump and European Commission President Ursula von der Leyen, which resulted in the U.S. deferring the planned 50% tariffs on EU goods until July 9. The development eased global trade concerns, prompting a shift away from safe-haven assets—excluding the Greenback—and helped propel global equity markets higher.
⭐️Personal comments NOVA:
Accumulated price zone around 3300, under selling pressure, mainly waiting for important economic news this week: GDP, FOMC
⭐️SET UP GOLD PRICE:
🔥SELL GOLD zone : 3363- 3365 SL 3370
TP1: $3352
TP2: $3340
TP3: $3325
🔥BUY GOLD zone: $3266- $3268 SL $3261
TP1: $3277
TP2: $3286
TP3: $3300
⭐️Technical analysis:
Based on technical indicators EMA 34, EMA89 and support resistance areas to set up a reasonable SELL order.
⭐️NOTE:
Note: Nova wishes traders to manage their capital well
- take the number of lots that match your capital
- Takeprofit equal to 4-6% of capital account
- Stoplose equal to 2-3% of capital account
$OKTA Gen AI tailwinds are not materializing as of now!- I'm a seller of NASDAQ:OKTA at $124 . Company was undervalued at 70s but has run so much without tangible materializing Gen AI tailwinds.
- Theoretically, Agentic AI should have been a great tailwind for SSO but it appears that industry is not yet focussed on security aspect of it when it comes to agentic AI.
- Even on application level, companies are struggling with developing orchestration framework and deploying them at Scale.
- Risk/Reward is not suitable for me to stay long. Short or Avoid/sell $OKTA.
- I might change my mind if they prove themselves today May 27, 2025.

SHORT ON US30US30 Has given us a nice pullback to a major supply area.
I am expecting price to rise a little higher into the supply are then give us a major drop to the previous swing low for over 1000 points!!!
I have placed a sell limit order withing the supply area looking to short us30 for the rest of the week.
