#WALUSDT continues its bearish momentum 📢 As long as the price stays under $0.6000 — short BYBIT:WALUSDT.P bias remains valid.
📢 Watch for further weakness!
📉 SHORT BYBIT:WALUSDT.P from $0.5794
🛡 Stop loss: $0.6000
🕒 Timeframe: 1H
✅ Overview:
➡️ The chart shows a clearly formed and broken Bearish Rectangle, confirming a short setup after price exited the range to the downside.
➡️ The $0.6090 support level has turned into strong resistance.
➡️ Entry at $0.5794 follows a textbook breakdown and retest structure.
➡️ Target area aligns with the volume-based support near POC $0.515, offering solid R:R.
🎯 TP Targets:
💎 TP 1: $0.5725
💎 TP 2: $0.5665
💎 TP 3: $0.5600
📢 Bearish structure confirmed with increased volume.
🚀 BYBIT:WALUSDT.P continues its bearish momentum — downside potential remains active!
Shortsetup

Bitcoin - Back Under Intersecting Bearish TrendlinesBitcoin is back underneath these two intersecting bearish trendlines.
I have laid out two potential paths Bitcoin could take to play this out.
When an asset in crypto goes only up for so long, it leaves behind a trail of leveraged liquidity in the form of stop losses. These wide open gaps filled with long stop losses, is the fuel that would make such a move possible. In other words, the sell orders are already in the chart in order to make this possible.
Personally, I expect this to happen.
DXY is showing a major breakdown and bearish retest at the moment - with a falling dollar over the next 2-3 years, that translates to a true bull market for Bitcoin and related assets.
The market has a very small time window to recollect all of the long position liquidity in the chart, which is in the billions.
See my previous posts to see confluences, liquidity mapping, etc.
Happy trading and I will be trading this myself.

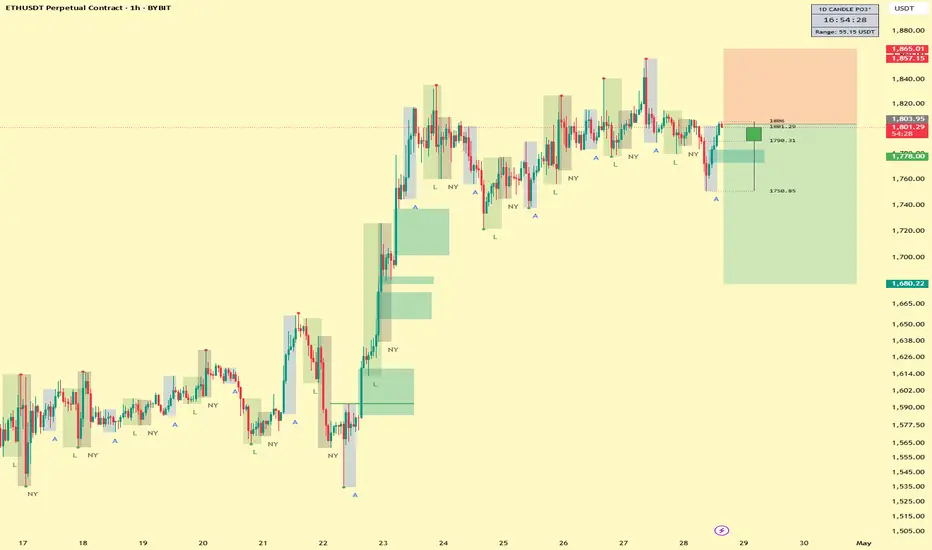
ETHUSD SHORT 1PercentFundedTICKER: ETHUSD
ENTRY 1: 1810
ENTRY 2: 1795
SL: 1865
TP1: 1720
TP2: 1680
Trade Active
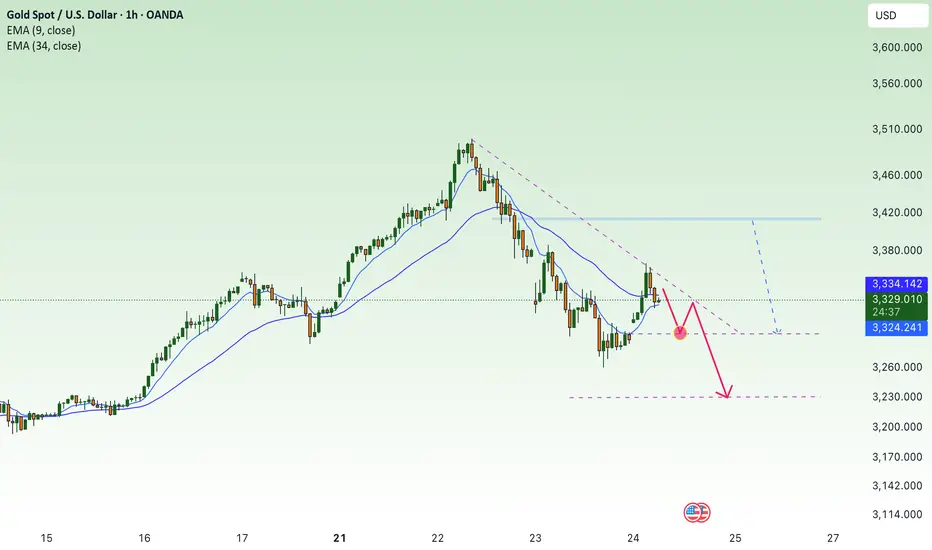
H4 downtrend line, gold price cools down✍️ NOVA hello everyone, Let's comment on gold price next week from 04/28/2025 - 05/02/2025
🔥 World situation:
Gold prices reversed course on Friday, wiping out Thursday’s gains and slipping below the $3,300 threshold, as persistent US Dollar strength weighed heavily on the precious metal despite declining US Treasury yields. The easing of tensions in the US-China trade dispute further pressured bullion, with XAU/USD trading around $3,294, down more than 1.6%.
Market sentiment remains fragile, swinging sharply between risk-on and risk-off modes in response to comments from US President Donald Trump. Earlier, Bloomberg reported that China was considering tariff exemptions on some US goods, sparking optimism. However, the mood soured after Trump asserted that he would not lift tariffs on China without significant concessions.
🔥 Identify:
News about Russia-Ukraine peace talks this weekend will continue to put selling pressure on gold prices next week. Moving along the downtrend line H4
🔥 Technically:
Based on the resistance and support areas of the gold price according to the H4 frame, NOVA identifies the important key areas as follows:
Resistance: $3357, $3498
Support : $3228, $3155
🔥 NOTE:
Note: Nova wishes traders to manage their capital well
- take the number of lots that match your capital
- Takeprofit equal to 4-6% of capital account
- Stoplose equal to 2-3% of capital account
- The winner is the one who sticks with the market the longest

Doge Usdt ShortHello dear friends, I have a short theory on Dogecoin with a specified stop. The market is closed and the volume is low, please manage your money.

Gold price heading below 3300⭐️GOLDEN INFORMATION:
Federal Reserve (Fed) officials have signaled openness to potential interest rate cuts, a stance that could limit further upside in the US Dollar (USD) and lend support to the non-yielding Gold price. Additionally, growing concerns over the economic repercussions of President Donald Trump’s aggressive tariff measures, combined with ongoing geopolitical instability, continue to bolster the appeal of safe-haven assets. In this environment, the broader bias for gold remains tilted to the upside, urging caution for traders considering bold bearish positions.
⭐️Personal comments NOVA:
continue sideways, price range fluctuates around 3300
⭐️SET UP GOLD PRICE:
🔥SELL GOLD zone : 3382- 3384 SL 3389
TP1: $3370
TP2: $3360
TP3: $3350
🔥BUY GOLD zone: $3294 - $3292 SL $3287
TP1: $3300
TP2: $3310
TP3: $3320
⭐️Technical analysis:
Based on technical indicators EMA 34, EMA89 and support resistance areas to set up a reasonable SELL order.
⭐️NOTE:
Note: Nova wishes traders to manage their capital well
- take the number of lots that match your capital
- Takeprofit equal to 4-6% of capital account
- Stoplose equal to 2-3% of capital account

AT&T I Tipping Point : Short Opportunity with Head & ShouldersHey traders after a previous trade trade on the hood hitting targets of 16.4%. Today I bring you NYSE:T
Technical + Fundamental View
Pro Tip
- Breakdown below the Entry Line will be considered at Trade Initiation. (Risky Traders)
R:R= 5.4
- Rest can follow entry at day close post breakdown SL above Entry Candle.
- The Breakdown Below the Entry Line will confirm the head and shoulder pattern
Entry Line - 26.93
Stoploss - 27.53
Target 1 - 25.59 (Neckline of head and shoulder)
Target 2 - 24.74
Target 3 - 23.68
Technical View
- Head And Shoulder on Daily Time frame
- On the hourly timeframe, the chart looks weak, showing a potential double top pattern where the second peak is lower than the first, indicating growing investor fear.
Fundamental View
- High Debt: Over $140 billion in debt limits investment capacity and consumes significant cash flow.
- Network Issues: Poor service quality and outages risk losing customers to competitors.
- Strong Competition : T-Mobile and Verizon offer better plans, making customer retention harder.
- Market Saturation: The U.S. wireless market is nearly saturated, limiting new customer growth.
- Execution Risks: Growth and debt reduction depend on flawless asset sales and network upgrades; delays could harm finances and stock performance.
Additional Considerations
- AT&T’s valuation is higher than some peers, potentially capping upside.
- Telecom market competitiveness means growth hinges on successful 5G and fiber rollouts.
- Dividend yield (~3.9%) is attractive but lower than some rivals, which may impact income investors.

Gold's short-term decline continues⭐️GOLDEN INFORMATION:
Gold price (XAU/USD) regained strong upward momentum during the Asian session on Thursday, rebounding sharply from the previous day’s steep decline and ending a two-day losing streak near the $3,260 weekly low. The renewed buying interest comes amid lingering concerns over the protracted trade impasse between the US and China, following US Treasury Secretary Scott Bessent’s comments indicating that the standoff could drag on.
Compounding market anxiety is the persistent uncertainty surrounding President Donald Trump’s tariff policies and their broader implications for global growth. These factors have fueled a fresh wave of safe-haven demand, driving investors back toward gold.
⭐️Personal comments NOVA:
Still under selling pressure, gold price is consolidating below the downtrend line. Trading around 3300 and lower.
⭐️SET UP GOLD PRICE:
🔥SELL GOLD zone : 3412- 3414 SL 3419
TP1: $3390
TP2: $3380
TP3: $3370
🔥BUY GOLD zone: $3228 - $3230 SL $3223
TP1: $3240
TP2: $3250
TP3: $3260
⭐️Technical analysis:
Based on technical indicators EMA 34, EMA89 and support resistance areas to set up a reasonable SELL order.
⭐️NOTE:
Note: Nova wishes traders to manage their capital well
- take the number of lots that match your capital
- Takeprofit equal to 4-6% of capital account
- Stoplose equal to 2-3% of capital account
SHORT ON SILVER XAG/USDSilver is currently at a major level of supply and is currently respecting it.
it has swept liquidity and is also over brought on the RSI.
I will be selling silver to the previous swing low / demand zone.

SHORT ON AUD/USDAUD/USD has given us a double top at a major resistance area/zone.
It has currently formed a lower high after giving us a change of character (choc) to the downside.
I expect price to drop to the next demand level for 200-300 pips.
Dxy News for the rest of the week should help fuel the move if positive for the dollar.

Panic Selling LINK? Here’s Your Master PlanBuckle up! LINK has been riding a relentless bearish trend for 113 days, ever since it kissed its peak of $30.94 back in December 2024. With economic uncertainty casting a shadow over the markets and fear gripping investors, the big questions loom: Is this the dip to buy while others panic-sell? Or is it wiser to sit on the sidelines? Let’s slice through the noise, dissect LINK’s chart like a seasoned pro, and uncover the setups that could turn this chaos into opportunity. Let’s dive in!
The Big Picture: LINK’s Bearish Blueprint
LINK is currently trading at $13, a far cry from its yearly open of $20. April has kicked off, and LINK has already surrendered the monthly open at $13.5, a critical level now acting as a brick wall overhead. Zooming out, the trend is unmistakably bearish: lower highs and lower lows dominate the chart. Adding fuel to the fire, LINK is languishing below the Point of Control (POC) at $14.32, derived from a 1.5-year trading range. This is a market screaming caution for bulls and whispering opportunity for bears, at least for now.
But charts don’t lie, and they’re packed with clues. Let’s map out the key levels, pinpoint trade setups, and arm ourselves with a plan that’d make even the most seasoned traders nod in approval.
Resistance Zones: Where Bears Sharpen Their Claws
1.) Resistance - The Golden Pocket ($13.6 - $13.7)
Using the Fibonacci retracement tool on the latest downward wave, the golden pocket (0.618 - 0.65 Fib) aligns beautifully with the monthly open at $13.5. Oh wait there’s more, this zone overlaps with a Fair Value Gap (FVG), making it a magnet for price action.
Trade Setup (Short):
Entry: ~$13.5 (if price tests and rejects this zone).
Stop Loss (SL): Above the recent swing high at $14.4.
Take Profit (TP): First target at $11.85 (swing low), with a stretch goal at $11.
Risk-to-Reward (R:R): A solid 2:1.
The Play: If LINK crawls up to this resistance and gets smacked down, bears can pounce. Watch for rejection candles (e.g., shooting star, bearish engulfing) to confirm the move.
2. Key Resistance - Cloud Edge & VWAP ($15.74 - $16.5)
The Cloud edge of my indicator sits at $15.74, while the anchored VWAP (from the $26.4 high) hovers at $16.5. A break above $16.5 would flip the script, snapping the bearish structure and signaling a potential trend reversal.
Bullish Scenario: If bulls reclaim $16.5 as support, it’s a green light for a long trade. Until then, this is a fortress for bears to defend.
The Play: No bullish setups here yet.
Support Zones: Where Bulls Build Their Base
1.) Support - Swing Low ($11.85)
This is the first line in the sand for bulls. A potential Swing Failure Pattern (SFP), where price dips below $11.85, sweeps liquidity, and reverses—could spark a long trade.
The Play: Watch for a bullish reversal candle or volume spike here.
2.) Major Support Cluster - The Golden Zone ($10 - $11.85)
This is where the chart sings a symphony of confluence:
Swing Low: $11.85.
POC: $11.33 (1.5-year trading range).
Monthly Level: $11.02.
Fib Retracement: 0.886 at $10.69 and 0.786 (log scale) at $10.77.
Psychological Level: $10.
Trade Setup (Long):
Entry: Dollar-Cost Average (DCA) between $11.85 and $10.
Stop Loss (SL): Below $10
Take Profit (TP): First target: $13.5 (monthly open), stretch goal: $20 (yearly open).
Risk-to-Reward (R:R): A monstrous 6:1 or better, depending on your average entry. This is the kind of trade we are looking for!
The Play: Patience is key. Wait for confirmation—think bullish engulfing candles, a surge in volume, or positive order-flow momentum. This isn’t a “hope and pray” trade; it’s a calculated ambush on the bears.
Market Structure: Bears Rule, But Bulls Lurk
Right now, LINK’s chart is a bear’s playground—lower highs, lower lows, and no bullish momentum to speak of. The $16.5 VWAP is the line in the sand for a trend shift, but until then, short trades take priority. That said, the $10 - $11.85 support zone is a coiled spring for bulls. If fear drives LINK into this range, it’s time to load the boat with longs—provided confirmation aligns.
Your Trading Edge
LINK’s 113-day bearish descent is a wild ride, but it’s not random chaos—it’s a roadmap. Bears can feast on rejections at $13.5 - $13.7 with a tidy 2:1 R:R short. Bulls, meanwhile, should stalk the $10 - $11.85 zone for a high-probability long with a 6:1+ R:R payoff. Whether you’re scalping the dips or swinging for the fences, these levels give you the edge to trade with confidence.
So, what’s it gonna be? Short the resistance and ride the wave down? Or stack bids at support and catch the reversal of a lifetime? The chart’s laid bare—now it’s your move. Drop your thoughts below, and let’s conquer this market together!
If you found this helpful, leave a like and comment below! Got requests for the next technical analysis? Let me know, I’m here to break down the charts you want to see.
Happy trading =)

EURUSD SHORT FORECAST Q2 W17 D23 Y25EURUSD SHORT FORECAST Q2 W17 D23 Y25
Professional Risk Managers👋
Welcome back to another FRGNT chart update📈
Diving into some Forex setups using predominantly higher time frame order blocks alongside confirmation breaks of structure.
Let’s see what price action is telling us today!
Trade confluences
- Weekly order block rejection
- Daily bearish close
- Intraday breaks of structure
- 15’ order block created
- Tokyo ranges to be filled
🔑 Remember, to participate in trading comes always with a degree of risk, therefore as professional risk managers it remains vital that we stick to our risk management plan as well as our trading strategies.
📈The rest, we leave to the balance of probabilities.
💡Fail to plan. Plan to fail.
🏆It has always been that simple.
❤️Good luck with your trading journey, I shall see you at the very top.
🎯Trade consistent, FRGNT X

GBPUSD Analysis with ICT ConceptsMy current outlook on the British Pound is bearish, with an expectation of lower levels in the near term.
A key level I am anticipating price to reach is the Weekly Open, which has not yet been touched.
Yesterday's price action seems to be confirming this potential move towards the Weekly Open.
Therefore, I am actively looking for confirmed short position opportunities to align with this view.
Trade safe!

SHORT ON NZD/USDNZD/USD Is currently at a major resistance level/zone and has created a double top or equal highs.
Price has started to fall a bit, but I do believe price will rise to take out the equal highs in a "Liquidity hunt"
Overall I am taking a market execution sell on NZD/USD to the next demand level looking to catch over 300+ pips.

Watch for a breakout from the #BANKUSDT📍 The price of MEXC:BANKUSDT.P is approaching the apex of the pattern — a breakout from consolidation is expected soon. The main scenario favors a downward breakout, with a short opportunity if confirmed.
📍 Important note: ➡️ Don’t rush the entry! Wait for a clear breakout from the pennant and confirmation of the direction.
📍 Beware of fakeouts — the key to success lies in confirmation with candle closes and volume.
📉 SHORT MEXC:BANKUSDT.P from $0.04118
🛡 Stop loss: $0.04284
🕒 Timeframe: 1H
📢 Overview:
➡️ The main structure of MEXC:BANKUSDT.P remains bearish, showing consolidation after a drop.
➡️ A break below the $0.04118 support will trigger the Bearish Pennant pattern.
➡️ Volume increase on the breakout will confirm sellers' dominance.
🎯 TP Targets for SHORT:
💎 TP 1: $0.04010
💎 TP 2: $0.03900
💎 TP 3: $0.03815
📢 Entry conditions for MEXC:BANKUSDT.P :
Enter only after a clear breakdown and candle close below $0.04118, ideally with volume confirmation.
📢 If the price holds above $0.04588, the structure may be invalidated, and the short scenario should be reconsidered.
📈 LONG MEXC:BANKUSDT.P from $0.04652
🛡 Stop loss: $0.04501
🕒 Timeframe: 1H
📢 Overview:
➡️ Price is compressing inside a Bearish Pennant, but there is still potential for a fake breakout upward.
➡️ A breakout above the pennant on strong volume may lead to a bullish impulse.
➡️ The $0.04652 level is key for a long entry after confirmation.
🎯 TP Targets for LONG:
💎 TP 1: $0.04760
💎 TP 2: $0.04870
💎 TP 3: $0.04970
📢 Entry conditions:
Enter only after a confident breakout above $0.04652 and a solid candle close (preferably with high volume).
🚀 Watch for a breakout from the MEXC:BANKUSDT.P structure and trade only in the confirmed direction. Either way — there is good movement potential and the R/R ratio is solid in both directions!

USDCHF SELLSPrice is still bearish therefore I’m only interested in sells for now. I’d wait for price to breakout of this h4 range then I’ll look for sells towards 0.78250 area.

CAKEUSDT Short Setup – Watching 2.40 Zone for RejectionHey Traders,
CAKEUSDT is currently trading within a well-defined downtrend, consistently forming lower highs and lower lows. The recent move appears to be a corrective rally, bringing price back toward a key daily resistance zone around 2.40, which also aligns with the descending trendline.
I’m monitoring this area closely for potential bearish price action to develop, signaling a continuation of the dominant bearish trend.
Key Confluences:
Major daily resistance at 2.40
Approaching descending trendline
Market still in a clear downtrend
Possible lower high formation in progress
Trade Plan:
If I see bearish confirmation in this zone (e.g. rejection candles, bearish structure break on lower timeframes, or weakening momentum).
A strong break and hold above 2.40 would invalidate the setup!

Is BTC Set up for a fall today? (17/04/2025)BTC has been ranging since last Friday and therefore the price action has been very tight but one candle has given us a clue about the possible next direction.
This has been highlighted by the red arrow. This 2H candle is a bearish engulfing candle, which as a single candle is bearish.
Since that candle was printed, the price has currently retraced into that candles range but has failed to break over it.
I am speculating that this is a failed high.
The blue arrow points to a wick on a subsequent 2H candle which signifies bullish exhaustion and a rejection of that 85000 price level.
The Green lines represent the High and Low price of the most recent 7H candle.
The Orange lines represents the High and Low price of yesterday's Daily candle.
The Red line represents the High and Low price of last week's candle.
There is a purple target beside a 2h FVG that I believe that market could be targeting alongside last weeks low.

SHORT ON NZD/JPYNZD/JPY is in a overall downtrend.
Price has completed its pullback phase to a key supply area and has created bearish divergence.
I expect price to drop to the next support level which was the previous low it created. (green line).
I am aiming to make 300-400 pips

Global Market Overview. Part 1: USDXThe Dollar Index is drifting at the key 99.5 mark. This strategic support level, which has held since early 2024, is on the verge of collapsing.
Let’s be clear: this isn’t just about the strength of the dollar. What’s at stake is the monetary sovereignty of the United States, caught between inflation, politics, and election-season hysteria.
And make no mistake — this has nothing to do with technical analysis. What we’re witnessing is a fundamental fire, and Donald Trump and his administration are fanning the flames.
Powell: “Rates remain unchanged.” But for how long?
Just days ago, Fed Chair Jerome Powell delivered what seemed to be a firm message:
“We are in a wait-and-see mode. Cutting rates prematurely could do harm.”
“If inflation accelerates, more difficult decisions may follow.”
On the surface — classic hawkish rhetoric. But in reality, this isn’t resolve.
It’s a delay tactic. Even Powell admits:
“The labor market is walking a fine line.”
“Economic growth weakened in Q1.”
“Business sentiment is deteriorating.”
“Tariff policy could lead to stagflation.”
“Political pressure is mounting by the week.”
The Fed says, “It’s too early to cut rates.”
But the market hears something entirely different: “We’re getting close.”
Trump applies pressure
Ahead of the elections, Trump declares:
“If we don’t cut rates now, we’ll lose to China, Europe, and our own markets.”
This isn’t just campaign rhetoric. It’s an open challenge to the Fed’s independence.
And history already tells us what happens when Trump applies pressure — 2019 rate cuts proved he can break through Powell’s defenses.
What the charts are saying
The Dollar Index (USDX) is locked in a persistent downward channel.
The 103.0 support zone has been broken
The 101.17 level remains the final significant support
99.5 is already being tested as a potential sell-off trigger
Below that — only air until 98.0 and 97.5
The technical setup confirms a fundamental truth:
The market no longer believes in the dollar’s strength.
What if the Fed actually cuts rates?
If the Fed moves to cut, USDX will break below 99 and enter a systemic phase of weakening.
Capital will flow into gold (as if it hasn’t already gone far enough), oil, crypto, and high-yield emerging markets.
The United States will lose its competitive edge in monetary policy,
and the dollar will slowly cease to function as the global anchor it once was.
Powell can talk tough all he wants. The market is no longer listening.
The Dollar Index isn’t dropping because rates are already cut — it’s falling because everyone knows it’s just a matter of time.
U.S. monetary policy has lost the initiative, and market expectations have taken over.
Today, the Fed rate is no longer a tool of control. It’s a signal of approaching capitulation.
The question is no longer “Can we hold 99.5?”
The real question is: “What happens after it breaks?”
Manipulation or strategy? Black swans on a leash
Powell’s rate policy, DXY charts, inflation forecasts — all of it loses clarity when the dominant market force is no longer economics, but politics.
We live in an era where markets break not from bad data, but from tweets, briefings, and backroom deals — moves that only reveal themselves in the charts after the fact.
That’s what makes the current cycle the most toxic in the last 15 years.
Markets aren’t just volatile — they’ve become irrational.
Trade war: scalpel in a surgeon’s hand or a bat in a brawler’s grip?
Tariffs aren’t new.
But in Trump’s hands, they’ve evolved — from macroeconomic tools to blunt political weapons.
He uses them as battering rams — to force concessions, corner opponents, and set up ideal conditions for insider gains.
The market reacts exactly as you’d expect:
Tariffs announced — indexes fall
Panic ensues — capital flees into dollars and gold
Within 48 hours — videos surface of Trump and his allies joking about the “hundreds of billions” they made during the crash
This isn’t conspiracy.
It’s already triggered official investigations, but everyone knows: the odds of accountability are near zero.
And that’s the biggest risk for fundamental analysis today:
It’s powerless against narratives crafted behind closed doors.
So who’s really running the market?
Trump is deliberately deflating the bubble. Loudly. Dramatically. On camera.
But the goal isn’t destruction. It’s control.
And while Powell fears making a mistake, Trump fears only one thing — losing control of the narrative.
The market is no longer a field for rational actors.
It has become a battlefield, where officials already understand:
You can control more than just money through the market — you can shape public consciousness.
How not to lose your footing in this chaos?
We’ll break it down in the next part of the Global Market Overview. Stay tuned.

$ADBE deteriorating MOAT ; Still Expensive; PT < $350- NASDAQ:ADBE is one of the blue chip company of the last decade.
- However, Chicken has come to roost.
- Core products of NASDAQ:ADBE like acrobat are useless. One can use ChatGPT or any AI tool to parse and get the information. Google Doc for creating a PDF
- Adobe designer tool might still be used but AI tools are taking over which provides done for you. Apart from that Canva & Figma are way better and easier to use NASDAQ:ADBE
- NASDAQ:ADBE products are hard to use and have huge learning curve. On top of that, NASDAQ:ADBE engages in shady subscription practices where it doesn't let user cancel subscription and ask people to go through customer support potentially delaying cancellation to bill users.
- NASDAQ:ADBE despite having huge datasets of images isn't able to launch a good AI model. Firefly by Adobe is Joke and not good enough.
Fundamentally, it is still trading at a premium.
Year | 2025 | 2026 | 2027 | 2028
EPS | 20.39 | 23.01 | 25.56 | 27.02
EPS % growth | 11.61% | 12.82% | 11.11% | 5.72%
Base Case ( Lenient ):
Ideally, for a blue chip company with a MOAT growing EPS at 11-15% ; Failr forward P/E should be 20. For them, who are willing to pay forward p/e of 20
Year | 2025 | 2026 | 2027 | 2028
Stock price (F. p/e = 20) | 407 | 460 | 500 | 540
Base Case ( conservative ):
However, I believe NASDAQ:ADBE MOAT has been severely challenged and should doesn't command a premium multiple. Therefore, according to me, fair forward p/e should be 15
Year | 2025 | 2026 | 2027 | 2028
Stock price (F. p/e=15) | 305 | 345 | 383 | 405
Extreme Bear Case :
If we account for recession, We could see further compression in forward p/e ~ 10. Extreme bear case, where they miss EPS or revenue or both and guide lower.
Year | 2025 | 2026 | 2027 | 2028
Stock price (F. p/e=10) | 200 | 230 | 255 | 270
Bull Case ( F. p/e = 25 )
Year | 2025 | 2026 | 2027 | 2028
Stock price (F. p/e=25) | 509 | 575 | 639 | 675

Amazon losing weekly trendline – watch these Fibo levels nextTechnical Analysis
Amazon (AMZN) has broken below its weekly ascending trendline and failed to reclaim the key 0.618 Fibonacci level (180.52). Strong bearish volume and a weakening RSI suggest downside continuation. Key support targets lie at 161.55, 151.21, and 142.58, with extended downside to 119.12.
Fundamentals
Macro pressure from high interest rates and a slowdown in consumer spending weighs on Amazon. Intense competition in AWS and e-commerce adds uncertainty. Upcoming earnings may serve as a catalyst for directional clarity.
Scenarios:
Base case – move down toward 151.21, 142.58, 119.12
Bullish case – break above 180.52 → rally toward 207.52, 241.92

Potential medium-term trend continuation? If this is the case of a trend continuation, then this current price provides a decent opportunity for a little medium-term swing. We would need to await further sell confirmation for entries. Targets would be the previous swing low at +-1.21000
I will update accordingly.
