SHORT ON US30US30 Has given a change of character (choc) on the 4hr TF indicating the end of its uptrend pullback on its overall downtrend.
I will be selling US30 to the next level of demand looking to capture over 1000 points.
Shortsignal

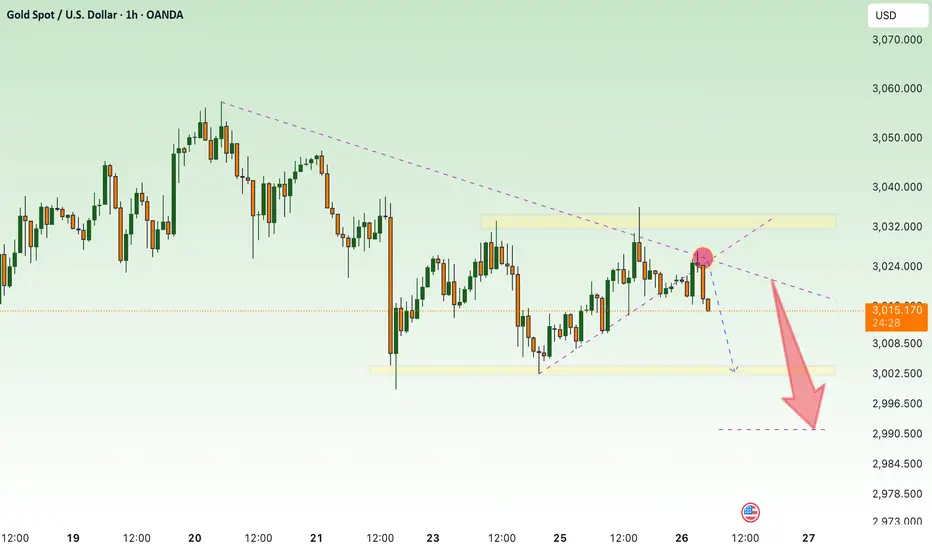
continue downtrend , GOLD⭐️GOLDEN INFORMATION:
Gold price (XAU/USD) holds steady above the key $3,000 level for the second consecutive day on Wednesday, though it struggles to reclaim the previous session’s peak. Ongoing uncertainty surrounding US President Donald Trump’s proposed reciprocal tariffs set for next week continues to bolster demand for the safe-haven metal. At the same time, the US Dollar (USD) remains under pressure following Tuesday’s weaker-than-expected macroeconomic data, providing additional support for gold’s upward momentum.
⭐️Personal comments NOVA:
Gold price continues to decrease, around 2990 - 3000
⭐️SET UP GOLD PRICE:
🔥SELL GOLD zone: $3039 - $3041 SL $3046
TP1: $3030
TP2: $3020
TP3: $3010
🔥BUY GOLD zone: $2992 - $2990 SL $2985
TP1: $3000
TP2: $3008
TP3: $3018
⭐️Technical analysis:
Based on technical indicators EMA 34, EMA89 and support resistance areas to set up a reasonable SELL order.
⭐️NOTE:
Note: Nova wishes traders to manage their capital well
- take the number of lots that match your capital
- Takeprofit equal to 4-6% of capital account
- Stoplose equal to 2-3% of capital account
SHORT ON NZD/JPYNZD/JPY Has rejected a major resistance area and is breaking structure to the downside.
The JPY index is looking strong from a major demand level. XXX/JPY pairs do the opposite of whatever the index does.
Therefore I will be selling NZD/JPY looking to catch over 200 pips easy.

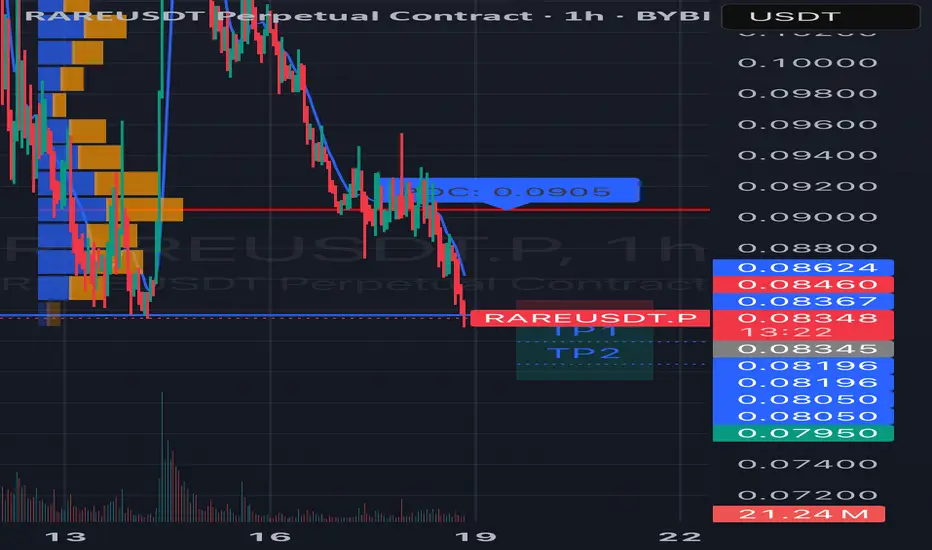
#RAREUSDT continues its downtrend📉 Short BYBIT:RAREUSDT.P from $0,08345
🛡 Stop loss $0,08460
🕒 1H Timeframe
⚡️ Overview:
➡️ The main POC (Point of Control) is 0,09094
🎯 TP Targets:
💎 TP 1: $0,08196
💎 TP 2: $0,08050
💎 TP 3: $0,07950
📢 Monitor key levels before entering the trade!
BYBIT:RAREUSDT.P continues its downtrend — watching for further movement!
SHORT ON GBPUSDGBPUSD has reached a key supply area and has given a change of character from up to down on the hour timeframe.
There is plenty imbalance/fvgs to the downside that I expect price to go and fill.
The Dollar Index is currently shifting to up from down, this should aid in this pair falling.
I will be selling GBPUSD to the next demand level for 300 pips.

#1000RATSUSDT maintains bearish momentum📉 SHORT BYBIT:1000RATSUSDT.P from $0.01823
🛡 Stop Loss: $0.01855
⏱ 15M Timeframe
✅ Overview:
➡️ BYBIT:1000RATSUSDT.P is in a downtrend after rejecting the descending trendline, confirming buyer weakness.
➡️ Volume Profile suggests that the main liquidity (POC) is positioned at $0.01938, reinforcing selling pressure.
➡️ The Head and Shoulders pattern strengthens the bearish case, and a break below $0.01823 will trigger further decline.
➡️ The main downside targets are in the $0.01800 – $0.01764 range, where profit-taking may occur.
⚡ Plan:
➡️ Short entry upon breaking $0.01823, confirming the bearish scenario.
➡️ Stop-Loss at $0.01855—placed above the nearest resistance to minimize risk.
➡️ Main targets: $0.01800, $0.01780, and $0.01764, where downside movement may slow down.
🎯 TP Targets:
💎 TP 1: $0.01800
🔥 TP 2: $0.01780
⚡ TP 3: $0.01764
🚀 BYBIT:1000RATSUSDT.P maintains bearish momentum — expecting further downside!
📢 BYBIT:1000RATSUSDT.P remains weak, and a breakdown below $0.01823 could accelerate the decline.
📢 Watch for price reactions near $0.01764, where a slowdown or bounce may occur.

TONUSDT: Bearish Setup or Bulls' Last Stand?
Hey, traders! 😱📉 BINANCE:TONUSDT.P is in a high-risk zone, and the market is tense. We see the price testing support at *3.6191 USDT*, while resistance at *3.6891 USDT* is keeping the pressure on.
The classic scenario: if support fails, we could see a sell-off. But what if the whales are lurking, ready to turn the price around?
🔑 *Key Levels:*
*Support:*
*3.6191 USDT* – bulls are defending this level aggressively.
*3.0087 USDT* – deep liquidity zone, where the price could drop if support breaks.
**Resistance:**
**3.6891 USDT** – if sellers hold this level, the downtrend continues.
**3.8000 USDT** – a breakout above here could mean a bullish reversal.
🚩 *Trading Strategy:*
*Short Entry:* After breaking *3.6191 USDT* with a retest.
*Stop-Loss:* Above *3.6891 USDT* – if bears are wrong, it's time to exit.
*Profit Targets:*
*3.5000 USDT* – quick scalp target.
*3.3000 USDT* – solid take-profit zone.
*3.0087 USDT* – full breakdown potential if panic selling intensifies.
📈 *Technical Analysis Insights:*
Sellers are dominating – market structure remains bearish.
Volume shows liquidity accumulating in this range.
If we see a bounce from *3.6191 USDT*, a short squeeze could trigger a sharp move up.
💡 *What to Watch For?*
*Manage risk!* A downtrend doesn’t mean going all-in.
*Wait for confirmation!* No clear break = possible liquidity grab.
*Watch volume!* False breakouts are common without strong volume support.
Is BINANCE:TONUSDT.P about to dump, or will bulls hold the line? Share your thoughts below! 🧐🔥

Downtrend #BUZZUSDT📉 SHORT BYBIT:BUZZUSDT.P from $0.02640
🛡 Stop Loss: $0.03010
⏱ 1H Timeframe
✅ Overview:
➡️ BYBIT:BUZZUSDT.P is in a strong downtrend, consistently forming new lower lows. The price continues to decline after rejecting $0.03584 (POC), confirming seller dominance.
➡️ The price is currently testing the $0.02700 support level, but given the overall trend, a further breakdown is likely.
➡️ If the $0.02640 level is broken and the price holds below it, a continuation toward $0.01999 is expected.
➡️ Volume is decreasing, indicating weak buyer support and a high probability of further downside.
⚡ Plan:
📉 Bearish Scenario:
➡️ Enter SHORT from $0.02640 if price confirms a breakdown.
➡️ Risk management with Stop-Loss at $0.03010, above the nearest resistance zone.
🎯 TP Target:
💎 TP1: $0.01999 — strong support and profit-taking zone.
🚀 BYBIT:BUZZUSDT.P Expecting a continuation of the downtrend!
📢 BYBIT:BUZZUSDT.P remains under selling pressure, and if the price breaks below $0.02640, further downside movement is likely.
📢 However, if the price reclaims $0.03010, the bearish scenario could be invalidated, leading to a potential bullish correction.

XLMUSDT: Bearish Pressure Rising – Breakdown or Fakeout?
💥 BINANCE:XLMUSDT.P continues its downtrend, struggling under a descending trendline, currently trading around 0.42018 USDT . The price has failed to break above resistance, strengthening the bearish momentum. Will we see a breakdown or a reversal soon?
---
🔑 Key Levels:
Support:
0.41998 USDT — immediate support currently being tested.
0.41651 USDT — a key level where buyers may step in.
0.40268 USDT — if price reaches here, bears are fully in control.
Resistance:
0.44319 USDT — critical level, a breakout here could break the downtrend.
0.44763 USDT — liquidity zone, potential upside target.
0.50000 USDT — longer-term target, requiring strong demand.
---
🚩 Trading Strategy:
Entry Points:
- A short setup if price breaks below 0.41998 USDT with strong volume confirmation.
- A long setup only if price shows a clear reversal above 0.44319 USDT .
Stop-Loss:
- Shorts should have SL above 0.44319 USDT .
- Longs should place SL below 0.41651 USDT to avoid liquidity traps.
Take-Profit Targets:
0.41530 USDT — first target for shorts.
0.40268 USDT — potential bottom where buyers may appear.
0.44763 USDT — in case of a bullish breakout.
---
📈 Technical Analysis:
The downtrend remains intact as long as price stays below the descending trendline.
Low trading volume suggests weak bullish momentum.
A breakdown could accelerate selling as long positions get liquidated.
---
💡 Conclusion:
Price is at a critical zone – if support fails, bears could push it below 0.40 USDT. The big question is: will this be a liquidity grab with a sharp reversal, or will bears keep the pressure on? Let's discuss! 🐻📉

USDIDR - Short Opportunity from resistance zonePEPPERSTONE:USDIDR is testing a significant resistance zone that has consistently reversed bullish trends into bearish moves. The recent bullish push into this area suggests potential selling opportunities.
I personally anticipate a move toward 16,215.2.
On the other hand, a break above this resistance could indicate a shift in sentiment.
Traders should monitor this zone closely and wait for confirmation before entering short positions. If you have any thoughts on this setup or additional insights, drop them in the comments!

GbpCad Short biasFirst trade set-up of the week. I'm looking to short from 1.76637. that's my poi. Till we clear previous week low which is Monday low 1.74561
That zone is interesting cause it is within an old week imbalance. Hence price would always be moved by Imbalance and Liquidity.
Please boost if you find this insightful 🫴

NDQ 19600 HEAD & SHOULDER FORMINGHead & Shoulder Formming Neck-Line At 20900
Global Scenarios- Iran War, Briac, Oil, Hmpv, Inflation Rates, Us Election Over
Will Come To Retest 200ema
After Aug 2024 4800pts(27%) Rally Healthy 10-15% Retracement

My plan keep SELLING GBPUSD all timeframe*Notice: It is Xmas and New Year holiday so that the Market is very slow and low volume. (reduce volume on your trading position)
About this Plan for OANDA:GBPUSD today:
- I saw a strong downtrend structure on almost timeframe of GU : D1 - H4 -H1
- I saw Confirmed downtrend signal on H1 and also H2 timeframe
So I make this plan for SHORT GBPUSD today:
Entry Zone: 1.25200 - 1.25300
Stoploss: 1.25700 (=1R)
Target Expected:
target 1: 1.24500
target 2: 1.23500 (RR= 4.1)

Bitcoin Short Signal | PRZ and Head & Shoulders Confirmation!🔹 Entry (Stop Sell): $96,900
🔹 Take Profit (TP): $90,740
🔹 Stop Loss (SL): $98,900
✨ As mentioned in the previous analysis, Bitcoin has completely filled the FVG at $96,500 and is now reacting to a 4H Order Block near the $98,400 level. The key highlight here is the confluence with a descending trendline, which previously acted as support but has now turned into strong resistance.
🔍 This critical intersection has created a PRZ (Potential Reversal Zone), increasing the likelihood of a rejection. Furthermore, it appears that Bitcoin is forming a Head & Shoulders reversal pattern on the 4H timeframe. This pattern provides an additional confirmation for the bearish rejection from the Order Block.
🎯 Targets: If the short position is triggered, the first target is $90,740. Breaking this level could lead to further downside.
⚠️ The confluence of the PRZ, Order Block, descending trendline, and Head & Shoulders pattern makes this a high-confidence short opportunity.

SHORT signal PNUTUSDT by Max Profit
1h TF. On the BINANCE:PNUTUSDT chart, a cascade of liquidity levels has formed below the current price, where participants' stop-losses are likely placed. These levels can act as fuel for a downward impulse. At the extremes, there is a noticeable increase in seller volume, which further confirms the weakness of buyers.
A local false breakout above the range was observed, signaling insufficient buyer strength to sustain a breakout of key levels. The ongoing seller pressure increases the likelihood of a downward price move.
🔑 Technical Context
A liquidity cascade below the current price forms the foundation for a potential downward impulse.
Increased selling volume at price extremes reinforces the bearish scenario.
A false breakout of the upper range boundary highlights buyer weakness and confirms the bearish market sentiment.
🚩 Execution Strategy
Wait for the price to compress towards the nearest liquidity level.
On the 5-minute timeframe, look for the formation of a local consolidation zone.
Enter the trade at the moment of the support level breakout.
Place the stop-loss above the local consolidation zone to minimize risks.
📈 Recommendations
Entry Timing: Use the 5-minute timeframe to accurately identify the breakout moment.
Risk Management: Set stop-losses based on the local consolidation zone to minimize potential losses.
Volume Analysis: Monitor further increases in selling volume at key levels to confirm the downward impulse.
Conclusion
At this stage, BINANCE:PNUTUSDT shows strong potential for downward movement. Implementing a strategy based on liquidity cascade breakouts and intensifying seller pressure allows for effective use of the current market conditions.

XAU ! 11/20 ! Gold sideways, holding above 2600XAU / USD trend forecast November 20, 2024
Gold prices (XAU/USD) continue their intraday retreat from the $2,642 level, a one-and-a-half-week high reached earlier on Wednesday, dropping to a new daily low during the early European session. The US Dollar (USD) gains support from dip-buying, fueled by a notable rise in US Treasury yields amid expectations of a more cautious approach to policy easing by the Federal Reserve (Fed). This shift in sentiment diverts investment flows away from the non-yielding yellow metal.
Gold price recovered, still maintaining above 2600, sideways price range 2600-2645
/// SELL XAU : zone 2629-2632
SL: 2637
TP: 50 - 100 - 300pips (2602)
Safe and profitable trading

$CHSN Short signal (my trading dairy)I will short trade NASDAQ:CHSN today if it started to rise after open, here is my reason:
1. Market maker sold out:
the price reached the resistance level from previous high with high volumes, which means half shares of the market cap has already sold. personally, i think those sold shares belong to the market maker.
2.Negative news:
SEC has ordered a suspension of trading in the company's securities on Oct 9, 2024 due to price manipulation activities.
3.Huge remained short volume
Compared to the volume and daily short volume of Oct 4th, Oct 7th, and Oct 22th, we could discover there is huge remained short volume.
Therefore I will short trade it tonight if it follow my expectation.

EOS bearish pattren formed in 4hr time frame as you see the EOS breaks previous support and now its trading below the 200 ema and 100 ema and price is at 4hr fib level there is high probability that price again reject from its supply area and retest the demand zone 0.4600
pattern type :- bearish rising wedge
trade type :- short
entry :-0.5411
sl :- 0.5670
traget:- 0.4590

Analysis of the GBPCAD currency pairIn the daily time frame, the price recently hit the ceiling of the ascending channel and at the same time we see a negative divergence in the RSI indicator. It is expected to see the price fall or correct to lower ranges.

SP500 Triple TopBears on the edge of their seats. Market seems indifferent to the rate cut. Look out below.

SUI Diamond Pattern Formation will Break to Downside (SHORT)I am Seeing a price crash and "V-Shape" recovery in the cards for the SUI price chart. Diamond pattern formation will break to the downside for a measured move down to the 1.618 fib extension. Fed emergency rate cut will reverse the markets back upwards into the US Elections.
Lower buy target @ or around 0.272

Bull run is over for coin maybeIt has lost the support of the trend it had for last few months. Unless it breaks above this trendline I tend towards bearish for coin. I was having a feeling it will cross 350 and then turn bearish but the chart looks bearish to me. Stay safe guys!

Bitcoin ShortOverall I am bullish on bitcoin but the PA is saying it’s not ready to start truly expanding higher yet. Looking for this TP and then a shift that will have us seeking new ATH.
