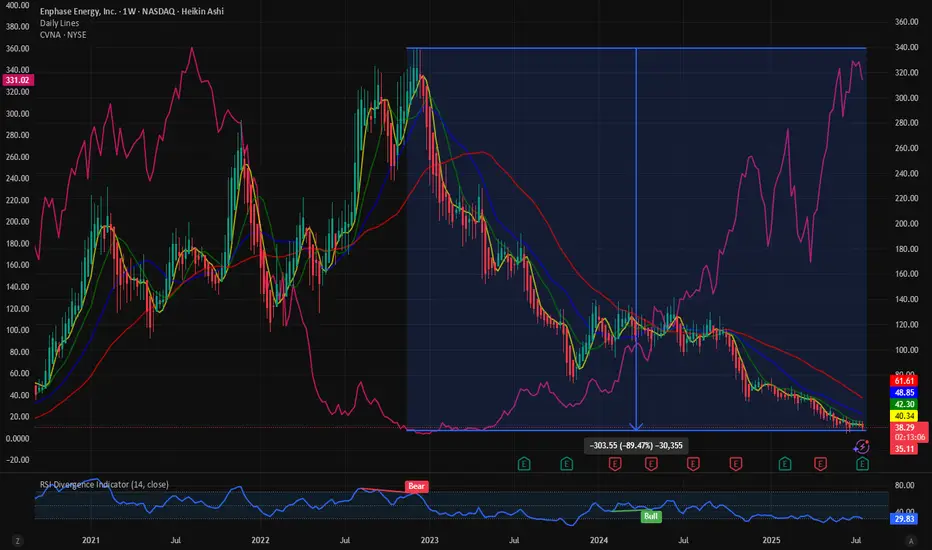
$ENPH:Clean energy stock and messy chart. Short squeeze incomingThe clean energy stocks are in a serious drawdown. NASDAQ:ENPH has a very messy stock. The stock has seen almost 88% of its value wiped out over the last 2 years. But is it the end of clean energy and stocks? With the new administration in place the clean energy stock has been in a bearish pattern.
In terms of the drawdown the stock looks the same as $CVNA. At its lowest NYSE:CVNA had 98% drawdown. NASDAQ:ENPH is down 90% and maybe it must go through a similar drawdown then the price must drop down to 10$.
Currently 21% of the NASDAQ:ENPH shares are sold short, and the short interest ratio is 3.77. These numbers indicate that there might be a danger of short squeeze with 21% of the shares sold short and it might take 4 days for the shorts to cover the positions. This is more than the current short squeeze candidate $OPEN. But is this a good time to buy?
In my opinion the price of NASDAQ:ENPH has some more room to downside. Out target is with price between 20$ - 10$ we can go long NASDAQ:ENPH
Verdict: More downside possible in $ENPH. Go long between 20$ -10 $. 21% Short interest.
Shortsqueeze
Golden Cross on GME WeeklyGME Chart Breakdown, Déjà Vu or Destiny? Something big just lit up the weekly chart, the 50 MA has pierced through the 200 MA, forming that golden cross traders dream about. On the weekly timeframe. Not a drill.
Now, let’s rewind. The last time this pattern appeared? January 2021. The infamous squeeze. Back then, GME didn’t just nudge upward, it catapulted nearly 4000%, going from a $3 floor to $120 in a blink.
Fast forward to today, new golden cross, new setup, and a $23 floor. If history rhymes even remotely, we’re staring down a hypothetical $1000 per share move. Yes, one thousand.
Is lightning about to strike twice? Stay tuned to find out!

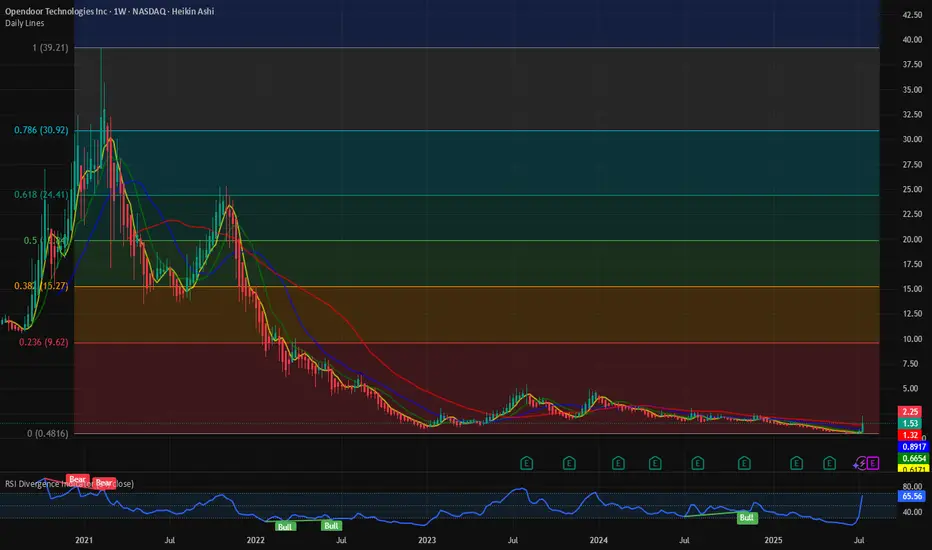
$OPEN: Ongoing short squeeze. What are the Fib levels telling? Are these the sign of a mature bull market? Drone cos, Space cos, SPACs, Biotech and Penny stocks are rallying. NASDAQ:OPEN is one such stock which hit the lowest of 0.5 $ last week before rallying more than 200% until July 18, 2025. NASDAQ:OPEN has a high short interest of almost 20% and short interest ratio is only 1.8 days to cover. Which means with 20% of the float short and the shorts needing 1.8 days to cover it might be ripe for a short squeeze if there is coordinated action by the bulls and a lot of call buying.
This might be a repeat of the meme stock rally scenario which we saw in 2021. But irrespective of the short situation from a technical standpoint what are the charts telling us. We go back to the tried and tested Fib Retracement levels to check the next price levels to watch for.
In my opinion the next price level to watch will be 9$ which might be a psychological level too. Many fund managers can only buy stocks if they are only above 10$. So, at that price we might see sellers offloading their gains. With next earnings call on Aug 5th and the Wallstreet bet crowd having a firm hold on the stock, we might see some explosive price action in the days and weeks to come before this settles The RSI is @ 60 which is not overbought, we can easily see 9 $ by end of summer if the social buzz continues.
Verdict: Buy NASDAQ:OPEN or Hold on to it if you have it. Offload some @ 9$.
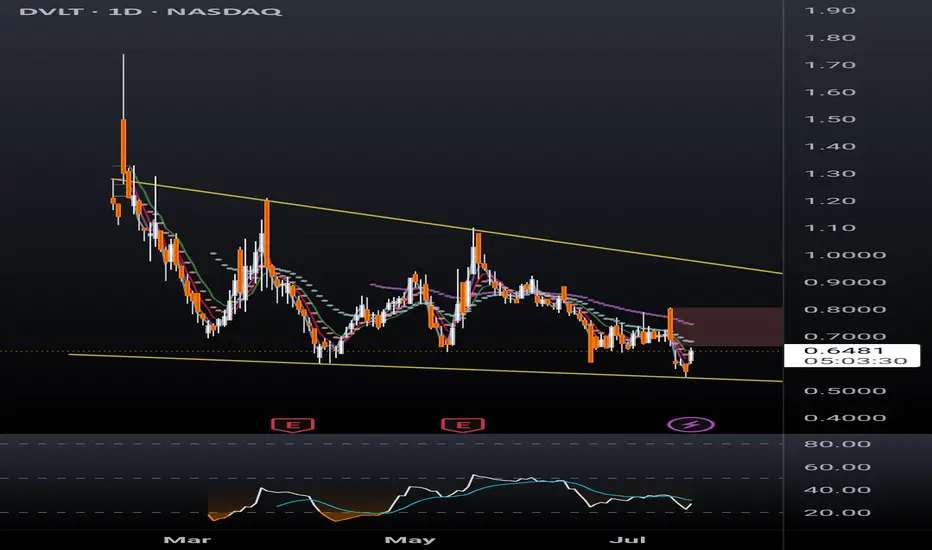
DVLT falling wedge, TP $1+DVLT a relatively new ticker is already drawing a lot of attention. Up 13% today after hitting new all time low yesterday, sure to catch a lot of eyes from retail investors. With recent news releases such as a licensing agreement with IBM, a lawsuit against naked short selling, and US patent allowances, target prices have been announced ranging from $3 to $11/share.
Disclaimer, this ticker is PRONE TO HEAVY DILUTION, however in order to remain listed on NASDAQ the SP will have to hit $1 and remain there. This being the case, the company must have something in the books to break upward out of this falling wedge and give shareholders a reason to stay with the company long term.
I'm just a cat not a financial advisor.
sideways in weekend downtrend⭐️GOLDEN INFORMATION:
Gold prices (XAU/USD) struggle to extend Thursday’s recovery from the $3,309 region—a one-week low—consolidating within a tight range during Friday’s Asian session. The US Dollar (USD) continues to retreat from its peak since June 23, pressured by dovish signals from Federal Reserve (Fed) Governor Christopher Waller.
Additionally, growing concerns over US President Donald Trump’s unpredictable trade policies and their potential consequences for global growth are keeping investors cautious, supporting demand for the safe-haven metal. These factors collectively help limit deeper losses in Gold, though the metal lacks clear bullish momentum for now.
⭐️Personal comments NOVA:
Gold price is moving sideways, accumulating in the downtrend line, not much fluctuation in weekend news
⭐️SET UP GOLD PRICE:
🔥SELL GOLD zone: 3381- 3379 SL 3386
TP1: $3370
TP2: $3360
TP3: $3350
🔥BUY GOLD zone: $3293-$3295 SL $3288
TP1: $3308
TP2: $3318
TP3: $3330
⭐️Technical analysis:
Based on technical indicators EMA 34, EMA89 and support resistance areas to set up a reasonable SELL order.
⭐️NOTE:
Note: Nova wishes traders to manage their capital well
- take the number of lots that match your capital
- Takeprofit equal to 4-6% of capital account
- Stoplose equal to 2-3% of capital account

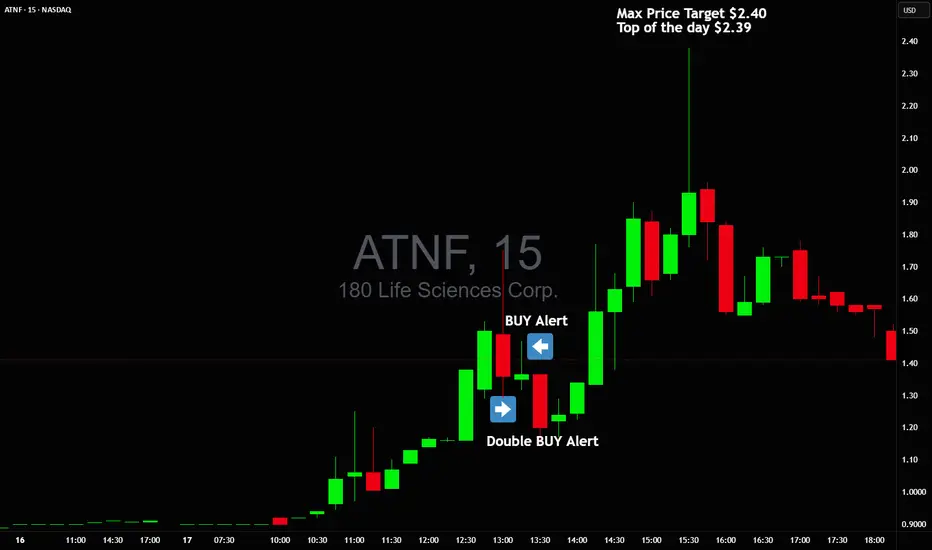
Double Buy Alert $1.35 avg with $2.40 max targetDouble Buy Alert $1.35 avg with $2.40 max target 🚀 High of the day was $2.39 🎯 NASDAQ:ATNF
Price action clearly signaled manipulation, I warned everyonw about it and sent out Double buy alert with new highs squeeze target!
Those who held all the way made +150% profit on this trade alone in 2 hours 💪🏻
NASDAQ:TELO NASDAQ:ABVE NASDAQ:NVDA NASDAQ:TSLA
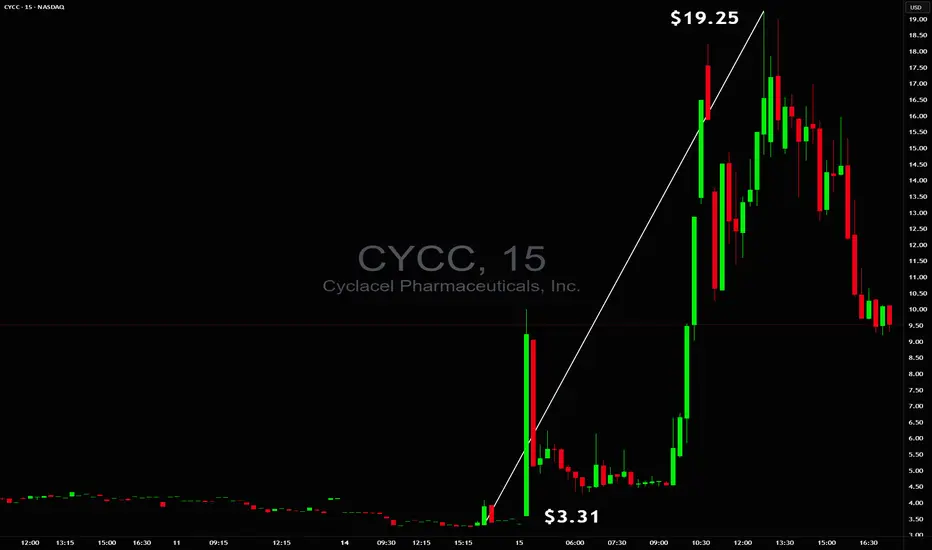
$3.31 to $19.25 in minutes$3.31 to $19.25 in minutes 🚀 but without a safe trade setup ❌ NASDAQ:CYCC
Too unstable to trade early while end of day there was a chance for power squeeze but even on 60M+ volume, tiny float and huge borrow fee they were able to reverse it so safe stop had to be respected ✔️
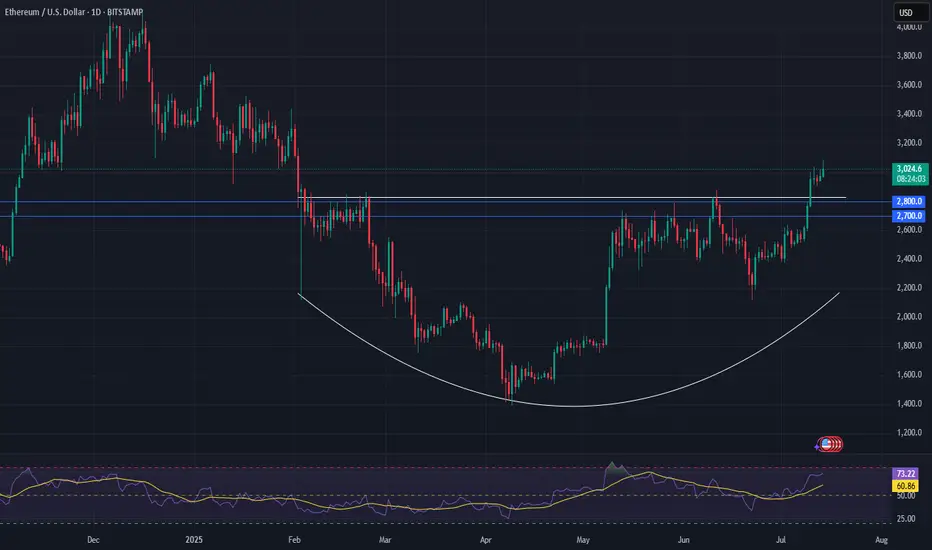
Ethereum Set for a Major Move — Watch $2,700–$2,800Epic Base Forming:
Ethereum is building a powerful base, and the fundamental dynamics have shifted significantly in recent weeks. With ETF fund flows hitting new highs, institutional interest is clearly growing.
Tight Setup for a Short Squeeze:
Meanwhile, the futures market shows a near-record short position, creating a high-potential setup for a massive short squeeze. Even without the chart, this kind of positioning mismatch is rare—and explosive.
Technical Watch Zone:
Ethereum is pressing into key resistance from a rounding bottom. The critical level to watch is $2,700–$2,800. A clean breakout here could ignite a sharp rally, with $4,000+ back on the table in short order.
This is a textbook setup—fundamentals, sentiment, and technicals are aligning.
#Ethereum #ETH #Crypto #TechnicalAnalysis #ShortSqueeze #ETFFlows #MarketSetup #Bullish #Altcoins #CryptoTrading #WatchList
Accumulated above 3300, market is sideways⭐️GOLDEN INFORMATION:
Gold prices posted modest gains on Wednesday, supported by a pullback in US Treasury yields, even as the US Dollar remained firm against major currencies. Market sentiment continued to be driven by trade developments, while the Federal Reserve’s latest meeting minutes revealed that policymakers are still leaning toward a rate cut in 2025. At the time of writing, XAU/USD is trading at $3,312, up 0.31%.
The FOMC minutes indicated that the majority of Fed officials believe a rate cut this year would be appropriate, with a few members open to the possibility of initiating a reduction as early as July—provided the economic data continues to align with expectations.
⭐️Personal comments NOVA:
Gold price recovered to 3320, mainly still accumulating, waiting psychology on current tariff situation of countries
⭐️SET UP GOLD PRICE:
🔥SELL GOLD zone: 3358- 3360 SL 3365
TP1: $3345
TP2: $3332
TP3: $3320
🔥BUY GOLD zone: $3245-$3247 SL $3240
TP1: $3256
TP2: $3269
TP3: $3280
⭐️Technical analysis:
Based on technical indicators EMA 34, EMA89 and support resistance areas to set up a reasonable BUY order.
⭐️NOTE:
Note: Nova wishes traders to manage their capital well
- take the number of lots that match your capital
- Takeprofit equal to 4-6% of capital account
- Stoplose equal to 2-3% of capital account

Strongest stock of the day with 3 Buy $CGTL1st and 3rd alert paid for the whole day, including 2nd which was cut quick at $1.70

Swing Pick $13 to $210 per share in less than 2 months$13 Buy in March to $200/share today! 😱
Swing Pick on 14th March to buy NASDAQ:RGC at $13.10 per share
Today's high is $210 per share 🔥
15X in less than 2 months, I wish I was still holding, congrats to those that still are 💸
You can also see posts about NASDAQ:RGC on my trading view from 2 months ago even the one mentioning it at $4 per share

1,700% in a day $NXTT from $0.31 to $5.67I've sent out buy alert at $1.50 as soon as I thought was safe enough to get in, even if I watched it before that but at that time volume was still too low and it was halting on both sides too much. It needed some extra time to get safer price action even if it meant missing some of the move, but at the end from $1.50 up to $5.50 is more than enough if you really wanted to milk it all the way.
NASDAQ:NXTT

Cold shower for bitcoinAs I mentioned earlier — when gold cools down, Bitcoin tends to rise. And when gold climbs, Bitcoin usually takes a breather. Don’t forget this dynamic.

$OBLG #OBLG BUY ALERT FOAT IS LOCKED, $17.6+ then $60+ INCOMING!NASDAQ:OBLG #OBLG NASDAQ:OBLG My name is Landon Wogalter & this is the next NYSE:GME #GME NYSE:GME / NYSE:HKD #HKD NYSE:HKD type move, I am also the reason that NASDAQ:CHSN #CHSN NASDAQ:CHSN went to $44 that I called & locked the float from <1.80 & called for $30+, & even emailed the company in August 24’ stating that their stock would see $30+.
Oblong price targets are as follows:
17.6+ , 60+, 150+, 2900 past 404< #FLOAT IS #LOCKED THERE IS NO OTHER SET UPS LIKE THIS ON THE MARKET AND NEVER HAS BEEN. #ZERO #DEBT OBLG wants #parabolic (This is not promotion nor/or financial advice😘) I’m your daddy forever & ever.

822% in 1 day from 0.36 to 3.32 that's current state of market🚨 822% in 1 day from 0.36 to 3.32 that’s the current state of how wild things are in the stock market 🔥 NASDAQ:RSLS
Lots of opportunities out there 👀 but as always you MUST take profit along the way, these mostly low quality stocks exploding on news which might be real or not, exploding on shortsellers getting trapped and squeezed. When the party is over they usually slide all the way down where they came from so you need to be smart and take profits.
800% in a day is enough, no need to be greedy for more and get surprised with drop saying the news company previously released is unverified or the offering company does overnight.

Ethereum THE GREATEST SHORT SQUEEZE in CRYPTO!ETH paired with BTC x GME stock
What happened to GameStop stock? This is very interesting because it helps to understand the “mechanics” behind the formation of such a specific arc (logarithmic chart).
1. Professionals were actively taking short positions.
2. Uncovered shorts forced sellers to buy back shares (to close positions) as the price increased, which further accelerated buying.
3. Volatility and price growth fueled enthusiasm, increasing demand and triggering a pump.
The GameStop situation was long considered a “retail victory,” but as it turned out, it wasn’t entirely so—it was a coordinated move by some major players against others who were heavily shorting the stock, being absolutely convinced of the company’s failure.
How much hate is there around ETH? How many bloggers are writing, “ETH is useless now”? Exactly. Meanwhile, ETH has 6-8 times the TVL of SOL!

A free signal for $GVVisionary NASDAQ:GV has secured a $1 billion financing consent letter with Qatar’s Alfardan Group to fuel R&D and global expansion of its PEGASUS new energy vehicles. This major funding will boost innovation, production, and market presence, positioning Visionary as a key player in the rapidly growing new energy vehicle industry. Stay tuned for more updates as Visionary accelerates its journey toward international success!

$Albemarle Harmonic Pattern and Short stock infoLooking at the daily chart for Albemarle, it appears to be to have a short sale harmonic pattern. The second pattern finished up today's trading with dramatic fashion. I'm looking for the same rebound to the $110 area in the next few weeks.
First go at publishing an idea!

A big move is brewing on this AI CoinAI the hypest narrative in the space today.
This coin has an interesting use case.
But most of all, the market cap is low enough for it to rip up.
The chart looks extremely bullish.
And perpetual funding rates keep oscillating into negative territory, possible due to large amounts of shorts piling in - meaning, a short squeeze is inevitable.

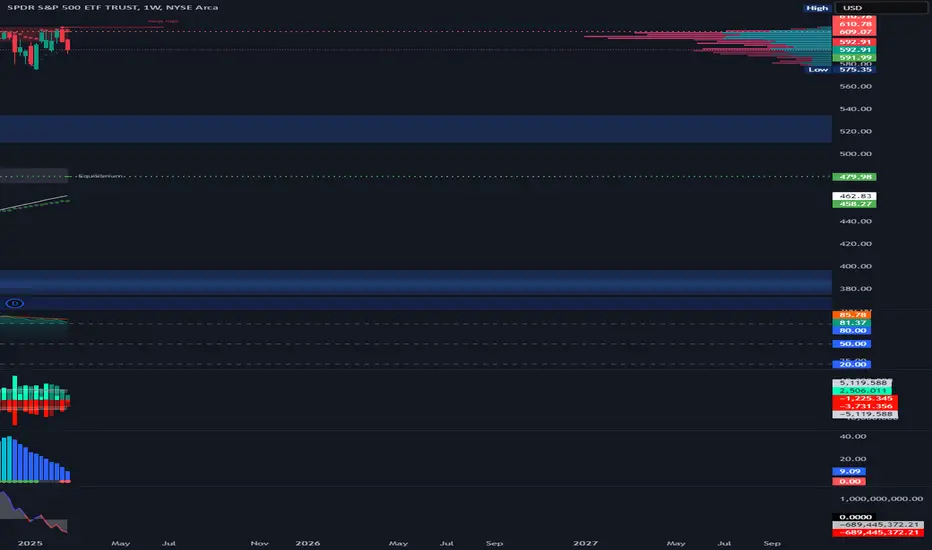
SPY Weekly Chart! I think downtrend has startedFrom a weekly chart perspective, I think we are going to start bear market pretty soon. Volume has been the lowest and I also see TTM squeeze in the weekly which was last seen in the pandemic era. I really think that investors should sell or cover their open positions.

SPY Weekly Chart! I think downtrend has startedFrom a weekly chart perspective, I think we are going to start bear market pretty soon. Volume has been the lowest and I also see TTM squeeze in the weekly which was last seen in the pandemic era. I really think that investors should sell or cover their open positions.
CELH Breakout: Can Buyers Hold the Line?CELH closed the week slightly above its IPO AVWAP on the highest volume ever, signaling significant short liquidation and a potential market sentiment shift. The immediate resistance at the $36 range aligns with a key consolidation zone, adding weight to its importance. With the weekly RSI approaching 50—historically a pivot point—a breakout above could strengthen the bullish case.
The volume spike indicates not only short covering but also potential new buyer accumulation. The SMI crossing up from oversold and the stock reclaiming the anchored VWAP above the 200-week moving average further support the strength of this move.
What’s crucial now is whether CELH can attract real buying interest above $36 once short-covering subsides. If this level holds, mid-$40s could be the next target, with significant resistance around $50. Ideally, I'd like to see a low-volume pullback that confirms new buyer support, suggesting a trend reversal rather than a short-term bounce.

Mobileye: The GAP is a TrapNASDAQ:MBLY : Calling it again!
The GAP is a Trap!
I'll gladly buy more with my Covered Calls Premium I made after that last POP! 😋
$20+ is coming! 🎯
Recent Lyft Robotaxi partnership news had them ripping to a tune of 18% at one point yesterday.
A massive pullback today, and I believe we will fill this GAP before continuing higher.
Not financial advice
