USD/CAD breaks the bearish structure-breaking bearish channel
-break the main resistance
-Confirm the upward trend
-momentum
-technical indicators
-fundamental analysis
Shortterm

US Dollar Is Rising Again The price broke the bearish structure after crossing two main resistances, the current correction on the 30-minute time frame is testing the key level 0.9550, if the rejection is achieved, it will target higher levels

XRP|USDT - Is Xrp on its way to 0.30 Looks like xrp is trading in a accumulation range. Will we see a breakout or some more downwards movement? I'm currently short on XRP.

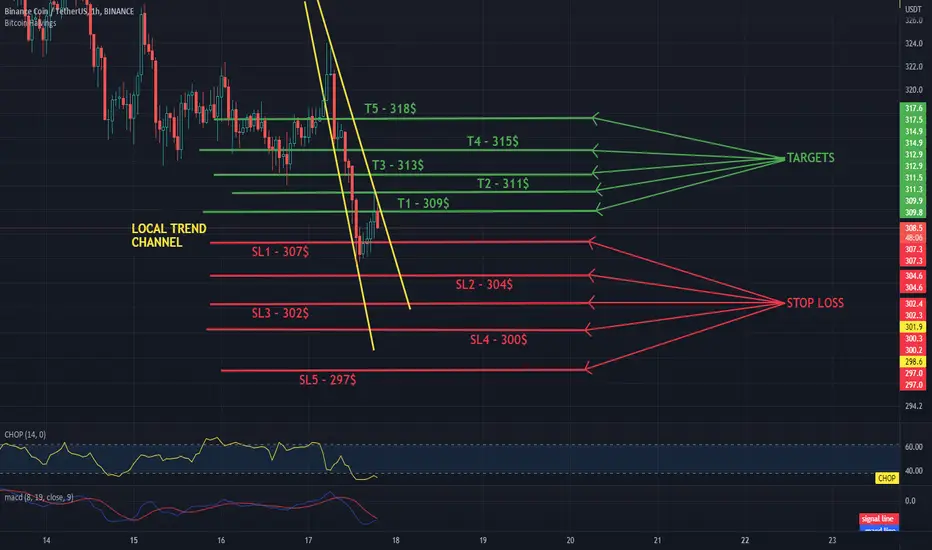
Daily short review of BNB interval 1HHello everyone, let's take a look at the 1H BNB to USDT chart as you can see the price is moving in the local downtrend channel.
Let's start by setting goals for the near future that we can consider:
T1 - $ 309
T2 - $ 311
T3 - $ 313
T4 - $ 315
and
T5 - $ 318
Now let's move on to the stop loss in case of further market declines:
SL1 - $ 307
SL2 - $ 304
SL3 - $ 302
SL4 - $ 300
and
SL5 - $ 297
Looking at the CHOP indicator, we can see that energy has been consumed in the 1H range, while the MACD indicator shows that the blue line is approaching the intersection of the red line from the bottom, which would confirm the local upward trend.
Short-Term OutlookHere's a short-term perspective. I believe we will get a bounce in the $22,000+ area.

BTCUSDT CryptocurrencyBTCUSDT 1DAY TIMEFRAME TECHANICAL ANALYSIS.
1 Hour timeframe price moving in channel pattern.
1daily timeframe price near major trendline and resistance area if price breakout trendline or resistance with high volume then price continue the breakout .

ETHUSDTHello my dear friends
I'm not very familiar with harmonic patterns, but according to price action, the price should enter a very quick correction.
It must be released from this state of compression.
If we want to look at the chart from a different point of view, it seems that if the price range of $1,655.52 is completely consumed and the first target of the pattern is hit, by observing the loss limit, we can reach the specified range (1,726.24 $) enter into the transaction.
We would be happy to hear your comments


Simple Ascending TrianglesJust a look at some ascending triangles forming on the BTC chart over the last couple of weeks. It just touched on the bottom trend line again in the past 24 hours, so I'm looking for a bounce up from here to the upper line. If we break below, than the triangles fall apart. Also looking for volume to increase as the lines converge, for a break to the upside. Otherwise, low volume could see the price reverse. I will be keeping an eye out for these triangles to narrow over the next week or two before reaching a head. This is a borderline rising wedge shape, but seeing as it is relatively flat on the top line, and the rising price from the prior two weeks, this looks to be a continuation in my eyes.
If the price does rise to the vertex, it should bring the price just above a big resistance level, and seeing as there isn't much resistance beyond that from ~$26k to ~$28k, breaking that could be more impetus for the price to break to the upside.


pound sell signal ! The US dollar pairs return to decline after corrective movements, the 200 EMA and 0.618 Fibonacci retracement, with the double top resistance level on the low time frame, I think it is a good entry point


USDCAD Local Buy from Support Welcome back! Let me know your thoughts in the comments!
**USDCAD - Listen to video!
We recommend that you keep this pair on your watchlist and enter when the entry criteria of your strategy is met.
Please support this idea with a LIKE and COMMENT if you find it useful and Click "Follow" on our profile if you'd like these trade ideas delivered straight to your email in the future.
Thanks for your continued support!
Brian & Kenya Horton, BK Forex Academy

Diwali Pick - COAL INDIA (Rs.169) 02-Nov-2021, (Dhanteras)
Diwali Pick - COAL INDIA (Rs.169)
Please do your own research as well before investing

short-term sell signalThe bullish trend that lasted for two weeks has been broken, breaking what we were waiting for to complete the main bearish trend. The lower tops and bottoms with the flag pattern and the 20-50 moving average are good indications to go short.

time to sell euro!In the few past days, the price has taken a secondary sideways trend, which is a temporary period until it completes the decline,
*Failed to break the resistance.
*15-minute uptrend break
*The main trend is down
*Overbought RSI
*moving average
*retest the previous resistance
good setup to go short

CADCHF I Short-term Buy from Support Welcome back! Let me know your thoughts in the comments!
**CADCHF - Listen to video!
We recommend that you keep this pair on your watchlist and enter when the entry criteria of your strategy is met.
Please support this idea with a LIKE and COMMENT if you find it useful and Click "Follow" on our profile if you'd like these trade ideas delivered straight to your email in the future.
Thanks for your continued support!
Brian & Kenya Horton, BK Forex Academy

ETCUSDT SPOTETC is going to PUMP (my view!)
ENTRY : 37.627
TP : target_1(42.157) and traget_2(50.31)
SL : 36.39
NOTE !!
- wait for 1h confirmation candle
- after target 1 , risk free the position and aim for target 2

Who is with me on BTC short term SELL????This analysis and trade are just for fun people. I was bored and wanted to have a bit of excitement.
So what do you think of the selling points in the chart?


US100 Short Position 1h Scaling EntryThis is one idea on US100 Reversal on the Resistance line with scaling entry.
Zone seems like this:
Entries with 1/4 of total amount risked on after confirmation of:
1)Range resistance retest. (12531.4)
2)Smaller negotiation area resistance retest. (12395.6)
3)Breaking of smaller negotiation area support. (12332.5)
4)Breaking of the Sign of Weakness of smaller. (12198.7)
Stop loss above the Swing High. (12694.5)
Target on the opposing edge of the zone. (11707.0)

SKLUSDTHello my dear friends
At the end of the descending channel, a tight movement is formed in the daily time frame!
The possibility of the price exiting from compression is both upward and downward.
But whichever way it exits, it will definitely be a very fast move (:
For me, it would be better to wait and enter the trade if the trend moves above $0.0616.
----> At the end of the trend, both ICHIMOKU and RSI issued a signal of formation of an uptrend.
It would be great if you share your thoughts with us.

GJ SHORT-TERM SELL SUGNALAfter confirming the break of the bullish trend in the 4-hour time frame price making corrective waves,0.618 Fibonacci retracement intersects with the resistance zone, and RSI overbought all of them support the idea of selling
