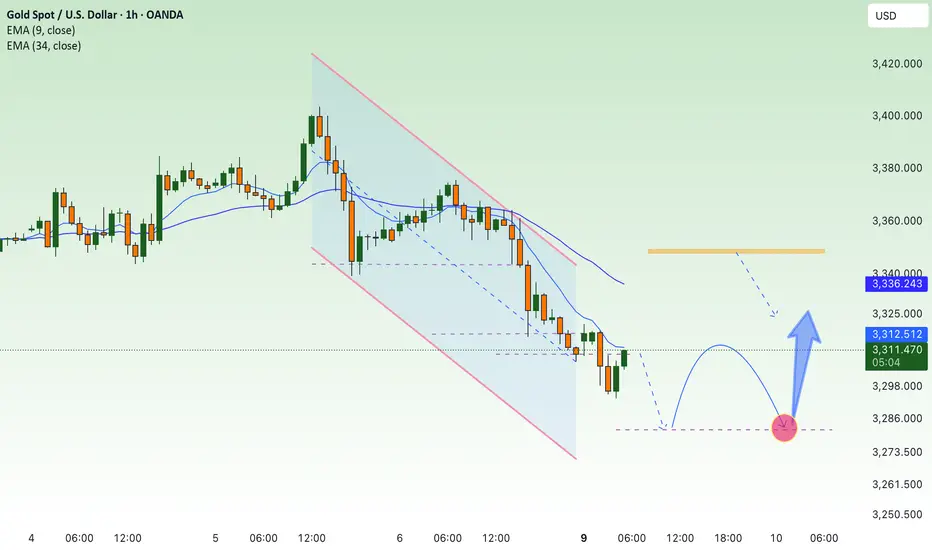
NF news, can gold selling pressure drop to 3240?⭐️GOLDEN INFORMATION:
Gold (XAU/USD) is trading lower, around $3,285 in early Asian hours on Friday, as a firmer U.S. dollar weighs on the non-yielding metal following new tariff measures announced by President Donald Trump.
The White House said late Thursday that Trump will set a 10% baseline tariff, stepping back from earlier speculation about hikes to 15% or higher, according to Bloomberg. He also signed an executive order raising the tariff on Canada from 25% to 35%, effective August 1, 2025, while extending Mexico’s current tariff rates for another 90 days to allow more time for negotiations.
⭐️Personal comments NOVA:
large frame, gold price is still moving in the downtrend line. will wait for NF result to have strong selling force again 3240
⭐️SET UP GOLD PRICE:
🔥SELL GOLD zone: 3374- 3376 SL 3381
TP1: $3365
TP2: $3350
TP3: $3333
🔥BUY GOLD zone: $3242-$3240 SL $3235
TP1: $3255
TP2: $3268
TP3: $3280
⭐️Technical analysis:
Based on technical indicators EMA 34, EMA89 and support resistance areas to set up a reasonable SELL order.
⭐️NOTE:
Note: Nova wishes traders to manage their capital well
- take the number of lots that match your capital
- Takeprofit equal to 4-6% of capital account
- Stoplose equal to 2-3% of capital account
Shorttrade

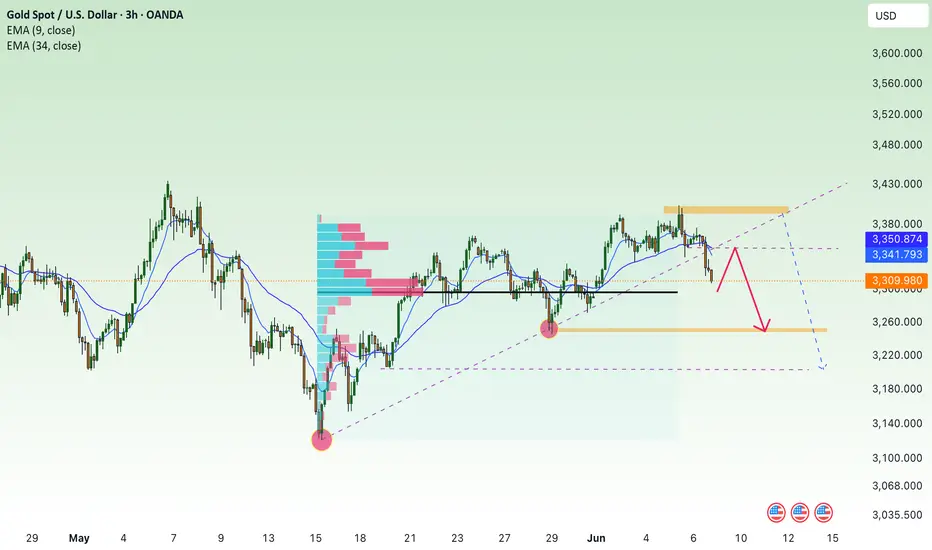
Gold price continues to decrease, keep the rate unchanged✍️ NOVA hello everyone, Let's comment on gold price next week from 07/28/2025 - 08/1/2025
⭐️GOLDEN INFORMATION:
Gold (XAU/USD) looks set to close the week lower, pressured by upbeat U.S. economic data and progress in trade negotiations, which have reduced demand for safe-haven assets. Despite declining U.S. Treasury yields, the U.S. Dollar regained some ground. At the time of writing, XAU/USD is trading around $3,336, down nearly 1%.
Looking ahead, the Federal Reserve is widely expected to keep interest rates steady at 4.25%–4.50% for the fifth time this year. Recent data supports this stance, with Initial Jobless Claims falling for the fourth straight week—signaling a resilient labor market—while Friday’s sharp drop in Durable Goods Orders, driven by weaker aircraft demand, adds a mixed tone to the outlook.
⭐️Personal comments NOVA:
Gold prices continue to fall as interest rates remain unchanged almost this week. Along with the H4 time frame, prices continue to break important support and continue to follow a downward trend.
🔥 Technically:
Based on the resistance and support areas of the gold price according to the H4 frame, NOVA identifies the important key areas as follows:
Resistance: $3350, $3428
Support: $3312, $3280, $3246
🔥 NOTE:
Note: Nova wishes traders to manage their capital well
- take the number of lots that match your capital
- Takeprofit equal to 4-6% of capital account
- Stoplose equal to 2-3% of capital account
- The winner is the one who sticks with the market the longest

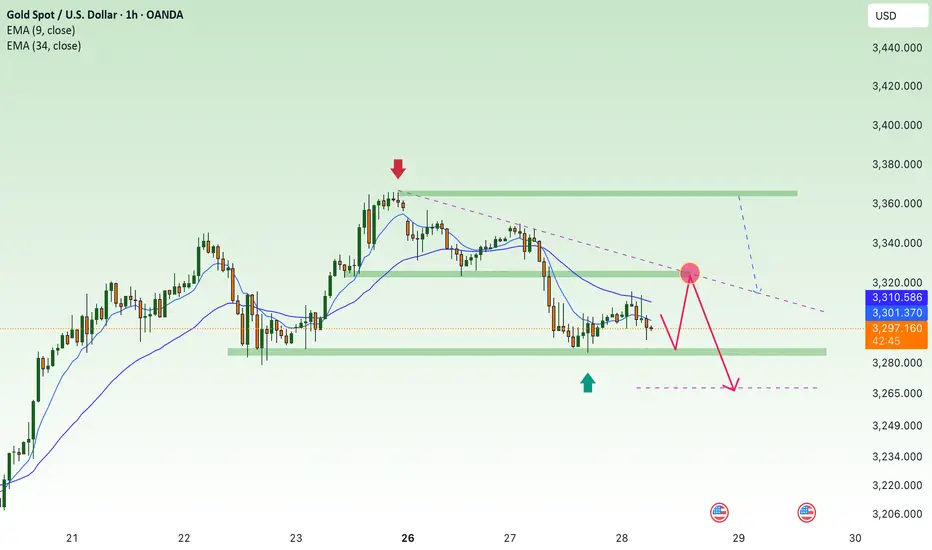
Gold selling pressure decreased at the end of the week⭐️GOLDEN INFORMATION:
Gold price (XAU/USD) remains under modest pressure during Friday’s Asian session, unable to build on the previous rebound from the mid-$3,300s. Renewed strength in the US Dollar, which extends its recovery from a multi-week low, acts as a headwind for the non-yielding metal. Additionally, fresh optimism surrounding the US-Japan trade agreement has dampened safe-haven demand, keeping gold on the defensive for the third consecutive day.
That said, lingering uncertainty over the Federal Reserve’s rate-cut trajectory, along with concerns about its independence amid growing political pressure, could limit the USD's upside. Meanwhile, rising geopolitical tensions—this time along the Thailand-Cambodia border—may lend some support to bullion. Investors now await US Durable Goods Orders data, which could influence the greenback’s direction and provide short-term cues for the XAU/USD pair going into the weekend.
⭐️Personal comments NOVA:
Gold prices are consolidating and starting to fall below 3400 to stabilize. The momentum for an early rate cut is waning.
⭐️SET UP GOLD PRICE:
🔥SELL GOLD zone: 3399- 3401 SL 3406
TP1: $3390
TP2: $3380
TP3: $3370
🔥BUY GOLD zone: $3310-$3312 SL $3305
TP1: $3325
TP2: $3333
TP3: $3345
⭐️Technical analysis:
Based on technical indicators EMA 34, EMA89 and support resistance areas to set up a reasonable SELL order.
⭐️NOTE:
Note: Nova wishes traders to manage their capital well
- take the number of lots that match your capital
- Takeprofit equal to 4-6% of capital account
- Stoplose equal to 2-3% of capital account

Gold prices under selling pressure from tariff policy⭐️GOLDEN INFORMATION:
Gold price (XAU/USD) stays under pressure during Thursday's Asian session, extending the sharp pullback from its highest level since June 16 seen the previous day. Optimism surrounding global trade continues to build, fueled by reports that the United States and the European Union (EU) are nearing a tariff agreement, following progress in the US-Japan trade deal. This upbeat sentiment has dampened safe-haven demand and is a major factor weighing on gold prices.
⭐️Personal comments NOVA:
Gold price adjusted down, broke support, faced selling pressure again, accumulated below 3400
⭐️SET UP GOLD PRICE:
🔥SELL GOLD zone: 3400- 3402 SL 3407
TP1: $3390
TP2: $3380
TP3: $3370
🔥BUY GOLD zone: $3356-$3354 SL $3349
TP1: $3365
TP2: $3373
TP3: $3382
⭐️Technical analysis:
Based on technical indicators EMA 34, EMA89 and support resistance areas to set up a reasonable SELL order.
⭐️NOTE:
Note: Nova wishes traders to manage their capital well
- take the number of lots that match your capital
- Takeprofit equal to 4-6% of capital account
- Stoplose equal to 2-3% of capital account

downtrend, gold price below 3300⭐️GOLDEN INFORMATION:
Gold prices (XAU/USD) remain under pressure during Wednesday’s Asian session, slipping below the $3,300 level and hitting their lowest point in over a week. The decline comes amid growing consensus that the Federal Reserve (Fed) will maintain interest rates at elevated levels for an extended period, especially as expectations rise that aggressive US tariffs could fuel inflation in the months ahead.
This outlook has driven US Treasury yields higher and kept the US Dollar (USD) anchored near a two-week high reached on Tuesday — a key headwind for the non-yielding precious metal, which continues to face downward pressure as a result.
⭐️Personal comments NOVA:
Gold price breaks support, DOW H1 formation, gold downtrend below 3300
⭐️SET UP GOLD PRICE:
🔥SELL GOLD zone: 3344- 3446 SL 3351
TP1: $3335
TP2: $3320
TP3: $3302
🔥BUY GOLD zone: $3256-$3254 SL $3249
TP1: $3268
TP2: $3280
TP3: $3298
⭐️Technical analysis:
Based on technical indicators EMA 34, EMA89 and support resistance areas to set up a reasonable SELL order.
⭐️NOTE:
Note: Nova wishes traders to manage their capital well
- take the number of lots that match your capital
- Takeprofit equal to 4-6% of capital account
- Stoplose equal to 2-3% of capital account

Bears pressure early week below 3300⭐️GOLDEN INFORMATION:
Gold prices (XAU/USD) face renewed selling pressure, dipping toward the $3,320 level during the early Asian session on Monday. The pullback comes as June’s stronger-than-expected US Nonfarm Payrolls (NFP) report has reshaped market expectations around the Federal Reserve’s (Fed) policy path. Investors now turn their attention to the upcoming release of the FOMC Minutes on Wednesday for further guidance.
The US economy added 147,000 jobs in June, beating expectations and slightly up from May’s revised figure of 144,000. Meanwhile, the Unemployment Rate held steady at 4.1%. These figures reinforced the view that the labor market remains resilient, thereby lowering the odds of an imminent Fed rate cut. As a result, the US Dollar has strengthened, weighing on non-yielding assets such as Gold.
⭐️Personal comments NOVA:
Downtrend at the beginning of the week, gold price returns to accumulate below 3300
⭐️SET UP GOLD PRICE:
🔥SELL GOLD zone: 3337- 3339 SL 3344
TP1: $3328
TP2: $3312
TP3: $3300
🔥BUY GOLD zone: $3297-$3295 SL $3290
TP1: $3308
TP2: $3320
TP3: $3330
⭐️Technical analysis:
Based on technical indicators EMA 34, EMA89 and support resistance areas to set up a reasonable SELL order.
⭐️NOTE:
Note: Nova wishes traders to manage their capital well
- take the number of lots that match your capital
- Takeprofit equal to 4-6% of capital account
- Stoplose equal to 2-3% of capital account

stable tariffs, gold price impact reduction✍️ NOVA hello everyone, Let's comment on gold price next week from 06/30/2025 - 07/04/2025
⭐️GOLDEN INFORMATION:
Gold prices plunged over 1.5% on Friday as risk appetite strengthened, fueled by a combination of positive geopolitical and economic developments. Easing tensions between Israel and Iran, the formal trade agreement between the United States and China, and continued efforts by Washington to strike new commercial deals with global partners lifted market sentiment—dampening demand for safe-haven assets like bullion.
At the time of writing, XAU/USD is trading at $3,274, having pulled back from an earlier high of $3,328. On Thursday, the White House confirmed the signing of a long-awaited trade pact with China, marking an official end to the protracted trade war. US Commerce Secretary Howard Lutnick also indicated that additional agreements may be finalized ahead of the July 9 deadline
⭐️Personal comments NOVA:
Information on tariff negotiations is gradually becoming stable and favorable. Information on inflation showing signs of increasing, dxy increase is also a temporary pressure causing gold price to return to the 3200 mark.
🔥 Technically:
Based on the resistance and support areas of the gold price according to the H4 frame, NOVA identifies the important key areas as follows:
Resistance: $3307, $3348, $3390
Support: $3248, $3202
🔥 NOTE:
Note: Nova wishes traders to manage their capital well
- take the number of lots that match your capital
- Takeprofit equal to 4-6% of capital account
- Stoplose equal to 2-3% of capital account
- The winner is the one who sticks with the market the longest

Strong weekend selling pressure, below 3300⭐️GOLDEN INFORMATION:
Gold prices (XAU/USD) came under renewed selling pressure during the Asian session on Friday, retreating below the $3,300 level after a lackluster performance the previous day. The precious metal is edging closer to the two-week low seen on Tuesday, as investors await the release of the US Personal Consumption Expenditures (PCE) Price Index. This key inflation gauge is expected to offer fresh insight into the Federal Reserve’s policy outlook and could significantly influence US Dollar (USD) movements—ultimately shaping the near-term trajectory of the non-yielding yellow metal.
⭐️Personal comments NOVA:
Selling pressure at the end of the week caused gold prices to fall below 3300, maintaining selling pressure and falling today
⭐️SET UP GOLD PRICE:
🔥SELL GOLD zone: 3326- 3328 SL 3333
TP1: $3315
TP2: $3302
TP3: $3290
🔥BUY GOLD zone: $3248-$3250 SL $3243
TP1: $3260
TP2: $3270
TP3: $3280
⭐️Technical analysis:
Based on technical indicators EMA 34, EMA89 and support resistance areas to set up a reasonable SELL order.
⭐️NOTE:
Note: Nova wishes traders to manage their capital well
- take the number of lots that match your capital
- Takeprofit equal to 4-6% of capital account
- Stoplose equal to 2-3% of capital account

BTC, Selling pressure below 100K, 23 JunePlan BTC today: 23 June 2025
Related Information:!!!
Market capitalisation fell to $3.03 trillion over the weekend, likely due to speculators expecting a sell-off in response to US strikes on targets in Iran. However, the limited reaction from traditional financial markets brought buyers back to the crypto space, showing their willingness to buy at a discount and pushing market capitalisation back up to $3.12 trillion.
The cryptocurrency sentiment index dropped to 42 on Sunday, its lowest level in two months, but rebounded to 47 at the start of the new week, moving from the fear zone into neutral territory.
Bitcoin slipped to $98K over the weekend, briefly touching the classic support level at 61.8% of the April–May rally. However, by the start of the European trading session, it had already recovered to around $102K, compared to $102.7K at the beginning of Sunday. Still, last week’s sell-off broke the 50-day moving average support, weighed down by external factors. A breakout from the $96K–$105K range will likely determine the direction of the next major move
personal opinion:!!!
Selling pressure caused gold price to drop below 100k yesterday, macro economy has not changed much. Gold price continues to suffer selling pressure
Important price zone to consider :!!!
support zone : 100.800 ; 98.200
Sustainable trading to beat the market

Bears under strong pressure, gold price adjusted⭐️GOLDEN INFORMATION:
Gold prices (XAU/USD) saw a modest rebound during Thursday’s Asian session, recovering part of the prior day’s decline and stabilizing around the $3,362–$3,363 zone, marking the weekly low. Lingering trade uncertainties and escalating geopolitical tensions in the Middle East continue to weigh on global risk sentiment, supporting demand for the safe-haven metal.
Meanwhile, the U.S. Federal Reserve concluded its two-day policy meeting on Wednesday by holding interest rates steady, while signaling a more cautious approach to future rate cuts. This shift, driven in part by concerns that President Donald Trump’s tariff policies could fuel inflation, boosted the U.S. Dollar to its highest level in over a week. The resulting Dollar strength is capping gold’s upside momentum, keeping the metal below the $3,400 threshold and prompting investors to remain cautious.
⭐️Personal comments NOVA:
Bears continue to put selling pressure on gold prices. Accumulating below 3400.
⭐️SET UP GOLD PRICE:
🔥SELL GOLD zone: 3414- 3416 SL 3421
TP1: $3402
TP2: $3390
TP3: $3376
🔥BUY GOLD zone: $3347-$3345 SL $3340
TP1: $3355
TP2: $3368
TP3: $3380
⭐️Technical analysis:
Based on technical indicators EMA 34, EMA89 and support resistance areas to set up a reasonable BUY order.
⭐️NOTE:
Note: Nova wishes traders to manage their capital well
- take the number of lots that match your capital
- Takeprofit equal to 4-6% of capital account
- Stoplose equal to 2-3% of capital account

GBPUSD consolidates resistance zone and declinesPlan GBPUSD day: 16 June 2025
Related Information: !!!
The Pound Sterling (GBP) ticks up to near 1.3590 against the US Dollar (USD) so far on Monday, remaining inside Friday’s trading range. The GBP/USD pair is expected to keep trading within a tight range as investors have sidelined ahead of monetary policy announcements by the Federal Reserve (Fed) and the Bank of England (BoE), due on Wednesday and Thursday, respectively.
At the start of the week, the US Dollar Index (DXY), which tracks the Greenback’s value against six major currencies, edges down to near 98.00.
Investors will closely monitor the interest rate guidance from both central banks, while they are expected to leave those unchanged at their current levels
personal opinion:!!!
At the beginning of the week, there was not much important news. GBPUSD price was sideways and reacted to resistance and support zones.
Important price zone to consider :
SELL point: zone 1.35950
Sustainable trading to beat the market

Adjusted down 3385 at the beginning of the week⭐️GOLDEN INFORMATION:
Gold prices (XAU/USD) climbed toward $3,445 during the early Asian session on Monday, marking their highest level in over a month as mounting tensions in the Middle East and growing expectations of a Federal Reserve rate cut bolstered demand for safe-haven assets.
Despite stronger-than-expected US economic data on Friday, investors remained focused on geopolitical risks. The University of Michigan’s Consumer Sentiment Index for June jumped to 60.5, well above the consensus forecast of 53.5 and May’s reading of 52.2. However, markets largely shrugged off the data.
Instead, attention turned to the escalating conflict in the Middle East, where Israel’s recent strike on Iran has intensified fears of broader regional instability. In response, Iranian authorities warned they would “respond firmly to any adventurism,” reinforcing gold’s appeal amid global uncertainty.
⭐️Personal comments NOVA:
At the beginning of the week, gold prices adjusted slightly down, returning to the liquidity zone of 3385, before continuing the uptrend.
⭐️SET UP GOLD PRICE:
🔥SELL GOLD zone: 3462- 3464 SL 3469
TP1: $3450
TP2: $3440
TP3: $3430
🔥BUY GOLD zone: $3390-$3388 SL $3383
TP1: $3400
TP2: $3410
TP3: $3422
⭐️Technical analysis:
Based on technical indicators EMA 34, EMA89 and support resistance areas to set up a reasonable SELL order.
⭐️NOTE:
Note: Nova wishes traders to manage their capital well
- take the number of lots that match your capital
- Takeprofit equal to 4-6% of capital account
- Stoplose equal to 2-3% of capital account

BITCOIN 2.5% Potential DropIt seems like BINANCE:BTCUSDT has lowered its trading volume and is potentially looking to make a correction in the upcoming days.

CPI, US inflation, gold price waiting to decrease⭐️GOLDEN INFORMATION:
Gold (XAU/USD) drew fresh bids in Wednesday’s Asian trading, reclaiming the $3,340 level and edging back toward this week’s high. A U.S. federal appeals court decision allowing President Donald Trump’s broad tariffs to remain in force—for now—added a fresh layer of trade uncertainty and stoked safe-haven demand. Heightened geopolitical tensions and growing expectations that the Federal Reserve will cut rates in September further bolstered the non-yielding metal. Even so, optimism surrounding ongoing U.S.–China talks has lifted broader risk sentiment, while a mildly stronger U.S. Dollar is helping keep gold’s upside in check.
⭐️Personal comments NOVA:
Gold price recovered, buying power increased gradually in Asian session, approaching resistance zone 3348
⭐️SET UP GOLD PRICE:
🔥SELL GOLD zone : 3373- 3375 SL 3380
TP1: $3360
TP2: $3350
TP3: $3340
🔥BUY GOLD zone: $3278- $3280 SL $3273
TP1: $3290
TP2: $3300
TP3: $3314
⭐️Technical analysis:
Based on technical indicators EMA 34, EMA89 and support resistance areas to set up a reasonable sell order.
⭐️NOTE:
Note: Nova wishes traders to manage their capital well
- take the number of lots that match your capital
- Takeprofit equal to 4-6% of capital account
- Stoplose equal to 2-3% of capital account

Gold price recovers, accumulates new week⭐️GOLDEN INFORMATION:
Gold prices (XAU/USD) hold steady near $3,310 during the early Asian trading hours on Monday, with the precious metal struggling to gain traction amid renewed strength in the US Dollar (USD). While a firmer Greenback poses headwinds for gold, lingering uncertainty surrounding President Donald Trump’s tariff strategy continues to offer some support.
On Friday, upbeat labor market data bolstered the dollar, pressuring dollar-denominated assets like gold. The US Bureau of Labor Statistics (BLS) reported that Nonfarm Payrolls rose by 139,000 in May, outpacing expectations of 130,000 and surpassing the previous month's downwardly revised figure of 147,000 (from 177,000). The stronger-than-expected jobs report has dampened hopes of near-term Fed rate cuts, weighing on bullion’s appeal.
⭐️Personal comments NOVA:
Gold price takes liquidity 3294, below 3300 GAP zone last week. Accumulate and react at lower support zones
⭐️SET UP GOLD PRICE:
🔥SELL GOLD zone : 3348- 3350 SL 3355
TP1: $3340
TP2: $3330
TP3: $3320
🔥BUY GOLD zone: $3281- $3279 SL $3274
TP1: $3292
TP2: $3300
TP3: $3315
⭐️Technical analysis:
Based on technical indicators EMA 34, EMA89 and support resistance areas to set up a reasonable sell order.
⭐️NOTE:
Note: Nova wishes traders to manage their capital well
- take the number of lots that match your capital
- Takeprofit equal to 4-6% of capital account
- Stoplose equal to 2-3% of capital account
Breaking the big frame, gold price returns to accumulation✍️ NOVA hello everyone, Let's comment on gold price next week from 06/09/2025 - 06/13/2025
🔥 World situation:
Gold prices declined for a second straight session on Friday, yet remain on track to close the week with a gain of over 1.30%, as traders recalibrate expectations for Federal Reserve policy easing following a stronger-than-expected U.S. Nonfarm Payrolls report. At the time of writing, XAU/USD is trading at $3,322, marking a 0.84% daily decline.
The U.S. Bureau of Labor Statistics (BLS) reported that the labor market continues to show resilience, with the unemployment rate holding steady from April. Meanwhile, Wall Street staged a modest rebound from Thursday’s losses, despite political tensions flaring between President Donald Trump and Tesla CEO Elon Musk, following the House's approval of a bill to raise the U.S. debt ceiling.
🔥 Identify:
Gold prices reacted lower after the release of good May employment data. Breaking the H4 uptrend line, gold prices continued to accumulate.
🔥 Technically:
Based on the resistance and support areas of the gold price according to the H4 frame, NOVA identifies the important key areas as follows:
Resistance: $3348, $3400
Support: $3251, $3202
🔥 NOTE:
Note: Nova wishes traders to manage their capital well
- take the number of lots that match your capital
- Takeprofit equal to 4-6% of capital account
- Stoplose equal to 2-3% of capital account
- The winner is the one who sticks with the market the longest
GBPUSD: Potential Reversal After Strong RallyThe British Pound has shown strong gains against the US Dollar, approaching a key resistance area. After such an extended move, a correction or reversal would be a logical expectation.
Technical Setup
There is a clear series of bearish divergences on the CCI (14) indicator. Price is forming a narrowing rising wedge, which often signals trend exhaustion.
Trade Plan
Sell limit orders: 1.3690 and 1.3850
Market entry: Only after confirmation — either a trendline break or a moving average crossover
Conclusion
GBPUSD shows signs of weakening at the top. I remain focused on short setups from resistance areas, waiting for confirmation to act.

Selling pressure, gold price falls below 3300⭐️GOLDEN INFORMATION:
Gold prices continued to retreat during Wednesday’s North American session, slipping below the $3,300 mark after reaching an intraday high of $3,325 earlier. The pullback, amounting to a 0.27% decline, came as traders absorbed the implications of the latest Federal Reserve (Fed) meeting minutes.
During the May 6–7 policy meeting, the Fed opted to leave interest rates unchanged, highlighting growing uncertainty surrounding the economic impact of proposed tariffs. Officials maintained a cautious stance, citing heightened risks of both inflation and unemployment—potential consequences of trade disruptions.
The minutes also reflected concerns over stagflation, with policymakers noting that “the Committee may face challenging trade-offs if inflation proves more persistent while growth and employment expectations deteriorate.”
⭐️Personal comments NOVA:
The downtrend line remains intact, gold prices are trading around below 3300. The tariff backdrop remains largely unchanged.
⭐️SET UP GOLD PRICE:
🔥SELL GOLD zone : 3311- 3313 SL 3318
TP1: $3300
TP2: $3290
TP3: $3280
🔥BUY GOLD zone: $3205- $3207 SL $3200
TP1: $3218
TP2: $3230
TP3: $3248
⭐️Technical analysis:
Based on technical indicators EMA 34, EMA89 and support resistance areas to set up a reasonable SELL order.
⭐️NOTE:
Note: Nova wishes traders to manage their capital well
- take the number of lots that match your capital
- Takeprofit equal to 4-6% of capital account
- Stoplose equal to 2-3% of capital account

Selling pressure, gold price continues to fall below 3285?⭐️GOLDEN INFORMATION:
Gold prices declined by nearly 2% on Monday, slipping below the $3,300 mark, as investor sentiment improved following U.S. President Donald Trump’s decision to postpone tariffs on European Union imports. The renewed risk appetite, coupled with a modest rebound in the U.S. Dollar from last week’s losses, placed pressure on the non-yielding precious metal.
The move came after a weekend call between President Trump and European Commission President Ursula von der Leyen, which resulted in the U.S. deferring the planned 50% tariffs on EU goods until July 9. The development eased global trade concerns, prompting a shift away from safe-haven assets—excluding the Greenback—and helped propel global equity markets higher.
⭐️Personal comments NOVA:
Accumulated price zone around 3300, under selling pressure, mainly waiting for important economic news this week: GDP, FOMC
⭐️SET UP GOLD PRICE:
🔥SELL GOLD zone : 3363- 3365 SL 3370
TP1: $3352
TP2: $3340
TP3: $3325
🔥BUY GOLD zone: $3266- $3268 SL $3261
TP1: $3277
TP2: $3286
TP3: $3300
⭐️Technical analysis:
Based on technical indicators EMA 34, EMA89 and support resistance areas to set up a reasonable SELL order.
⭐️NOTE:
Note: Nova wishes traders to manage their capital well
- take the number of lots that match your capital
- Takeprofit equal to 4-6% of capital account
- Stoplose equal to 2-3% of capital account
#COOKIEUSDT maintains bearish momentum📉 SHORT BYBIT:COOKIEUSDT.P from $0.2787
🛡 Stop loss: $0.2925
🕒 Timeframe: 4H
✅ Market Overview:
➡️ A Rising Wedge pattern has formed and broken down, confirming bearish momentum.
➡️ Price has broken below the wedge and the POC level at $0.2976, turning it into resistance.
➡️ Strong volume cluster at $0.2976–$0.2925 is now likely to act as a rejection zone.
➡️ Bearish pressure is visible through high-volume red candles.
➡️ Arrows on the chart indicate a continuation toward the take-profit levels.
🎯 TP Targets:
💎 TP 1: $0.2660
💎 TP 2: $0.2515
💎 TP 3: $0.2395
📢 Watch how price reacts BYBIT:COOKIEUSDT.P to TP1 — weak bounce may signal room for deeper drop.
🚀 BYBIT:COOKIEUSDT.P maintains bearish momentum — further downside expected!

The Bitcoin “Big Short”: Whales Are Quietly Leaving the PartyBitcoin just broke $111,000. Headlines are celebrating. Retail is euphoric. But under the surface, on-chain data tells a very different story: wallets holding over $1,000,000 in BTC—commonly referred to as whales—are quietly exiting.
According to Glassnode, the number of $1M+ wallets has dropped by nearly 9% over the last 60 days, even as price soared to new highs. This isn't a coincidence. It's the classic distribution phase—whales cashing out while late-stage buyers, lured in by ETF hype and bullish momentum, absorb the risk.
Bloomberg Crypto reported this month that over $10 billion in BTC has been moved from cold storage to exchanges, much of it from long-dormant wallets and miner reserves. This pattern echoes what we saw before the 2021 crash—strategic selling into strength.
ETFs: Fuel and Trap
Spot Bitcoin ETFs were pitched as the final gateway to mass adoption. In reality, they’re a liquidity funnel. Retail investors pile in via retirement accounts and brokerages, buying exposure—but not the asset itself. Meanwhile, institutional whales sell BTC into these passive flows.
As Bloomberg’s ETF Weekly noted in May 2025, “The majority of ETF inflows are retail-led, while OTC desks are reporting increased large-lot sell requests.” It’s a perfect storm: passive inflows mask whale exits, and the average buyer is blind to what’s really happening on-chain.
On-Chain Red Flags
The blockchain doesn’t lie. Key warning signs are flashing:
$1M+ wallets falling: Down from ~139K to ~126K since March.
Exchange reserves rising: Indicating coins are being positioned for liquidation.
Long-term holder profit-taking: SOPR is above 1.6—profit margins not seen since the last major top.
Dormant coins awakening: Older UTXOs (2+ years) are being spent at the fastest rate since late 2021.
Even miners are capitulating. Miner-held balances are down 12% YTD, and transfer spikes suggest they're taking advantage of inflated prices to fund operations.
Why It Matters
This isn’t FUD. It’s math. When the most informed market participants offload supply into a leveraged, overextended retail-driven rally, the result is rarely soft. If BTC loses key support around $95K, the slide to $60K—or lower—could be violent and fast.
The chart may look bullish. But the blockchain shows distribution, not accumulation. The whales aren’t tweeting. They’re cashing out.
Retail is late to the party. The smart money is already gone.
APPLY CAUTION EURGBP SHORT FORECAST Q2 W21 D22 Y25EURGBP SHORT FORECAST Q2 W21 D22 Y25
Professional Risk Managers👋
Welcome back to another FRGNT chart update📈
Diving into some Forex setups using predominantly higher time frame order blocks alongside confirmation breaks of structure.
Let’s see what price action is telling us today!
💡Here are some trade confluences📝
✅Weekly order block
✅15' order block
✅Intraday bearish breaks of structure
✅Tokyo ranges to be filled
🔑 Remember, to participate in trading comes always with a degree of risk, therefore as professional risk managers it remains vital that we stick to our risk management plan as well as our trading strategies.
📈The rest, we leave to the balance of probabilities.
💡Fail to plan. Plan to fail.
🏆It has always been that simple.
❤️Good luck with your trading journey, I shall see you at the very top.
🎯Trade consistent, FRGNT X

Gold back below 3200 today?⭐️GOLDEN INFORMATION:
Gold prices (XAU/USD) edged lower to around $3,230 during early Asian trading on Tuesday, weighed slightly by a modest rebound in the US Dollar (USD). However, lingering concerns over the health of the US economy—especially in the wake of Moody’s recent credit rating downgrade—may help limit further downside for the precious metal.
The Greenback’s recovery is curbing upside momentum for USD-denominated assets like gold. Still, heightened economic uncertainty continues to underpin safe-haven demand. Moody’s downgraded the US sovereign rating from "Aaa" to "Aa1" on Friday, citing escalating debt levels and interest obligations that now exceed those of other similarly rated nations. These developments are keeping risk sentiment fragile and lending underlying support to gold prices.
⭐️Personal comments NOVA:
Accumulate along the upper and lower trend lines, gold price will break and take more liquidity than the downtrend
⭐️SET UP GOLD PRICE:
🔥SELL GOLD zone : 3224- 3226 SL 3230 scalping
TP1: $3215
TP2: $3208
TP3: $3200
🔥SELL GOLD zone : 3276- 3278 SL 3283 scalping
TP1: $3260
TP2: $3250
TP3: $3240
🔥BUY GOLD zone: $3152 - $3150 SL $3145
TP1: $3165
TP2: $3180
TP3: $3195
⭐️Technical analysis:
Based on technical indicators EMA 34, EMA89 and support resistance areas to set up a reasonable SELL order.
⭐️NOTE:
Note: Nova wishes traders to manage their capital well
- take the number of lots that match your capital
- Takeprofit equal to 4-6% of capital account
- Stoplose equal to 2-3% of capital account
16 hours ago
