GOLD 21/6!! A slight recovery after the fallThe price of gold (XAU/USD) remains at a low point for the week, recovering from a three-day decline near $1,937. Investors are getting ready for an important event this week, which is the bi-annual testimony of Fed Chair Jerome Powell. It's important to mention that negative news about China, along with the Federal Reserve's hawkish stance and positive data from the United States, are keeping the bears in the XAU/USD market optimistic.
Expect a slight recovery of the downtrend on June 20. But the downtrend is still dominant
Can SELL price range $1946-$1950, SL 1960
Based on 2 technical indicators EMA 34, EMA 89 combined with the MACD, it shows that the 9 EMA crosses the upward signal line, showing divergence.
Shorttrade

GOLD 19/6 @ Downtrend prevailsThe price of gold (XAU/USD) is currently being affected by negative market sentiment towards China and concerns about the Federal Reserve (Fed). It is currently trading near its lowest point of the day, around $1,955 in early Monday trading in Europe.
Recent news about several banks lowering their growth forecasts for China has dampened investor appetite for risk and put downward pressure on the price of gold. Additionally, comments from Fed policymakers that lean towards a more hawkish stance, along with the latest report from the US central bank to Congress, have also influenced the XAU/USD price.
It is also because of pressure from bad news from the world. Gold price has not been able to break through the Break out area of $1968, it is still trending down this week, June 19, 2023
Entry Short $1968 -$1970 , Buy zone $1943 - 1940
Use the technical analysis indicator strong resistance point at $1968 combined with the moving averages MA34 and MA89 , for a nice entry point .

Bitcoin faster than expected.New downward channel forming (note inverted chart). Expected it to follow the blue line. In this new descending channel it seems bitcoin is struggling to even oscillate through here and is getting forced down faster than i had anticipated (see my other chart). Looking to buy around 25k and then again 20-21k.

BTCUSDT-SHORTBased on my analysis, it is likely that Bitcoin's value will experience a decline in the near future.

GOLD 16/6: sideway in bearish zoneFollowing the US's decision to halt interest rate hikes, the European Central Bank (ECB) raised interest rates by 0.25 percentage points in order to boost interest rates in the euro area to 3.5%. As a result, the US dollar significantly depreciated against several currencies, causing a sharp decline in US bond yields.
Consequently, the appeal of USD and bonds diminished for investors, leading them to redirect their investments towards precious metals. Consequently, the global price of gold occasionally experiences substantial increases of tens of USD per ounce.
Gold price on June 16 is fluctuating at $1961 level
Met strong resistance at the price range $1965 - $1967. The short-term main trend is not strong enough to overcome the resistance, watch for SHORT
Technical indicators are approaching oversold levels, and the 34 and 89 EMAs are currently moving around the $1961 level.

Get to the copper! 🐻🚁The industrial metals market often goes unnoticed by many traders, although some excellent trading opportunities are often to be found here. And with that, we say, "Get to the copper!" For things should get moving here quite soon. The completion of wave (ii) in magenta should be imminent here, the copper price should therefore initiate a bearish trend reversal in our target zone (highlighted in blue) and then indulge in extended sell-offs. Thus, depositing short positions between $3.89 and 3.96 should present an excellent opportunity to profit from the lift-off of the bearish chopper - which is, of course, headed south. We anticipate a significant sell-off before wave (iii) in magenta will at some later point be completed, at which point the bulls are expected to report back.

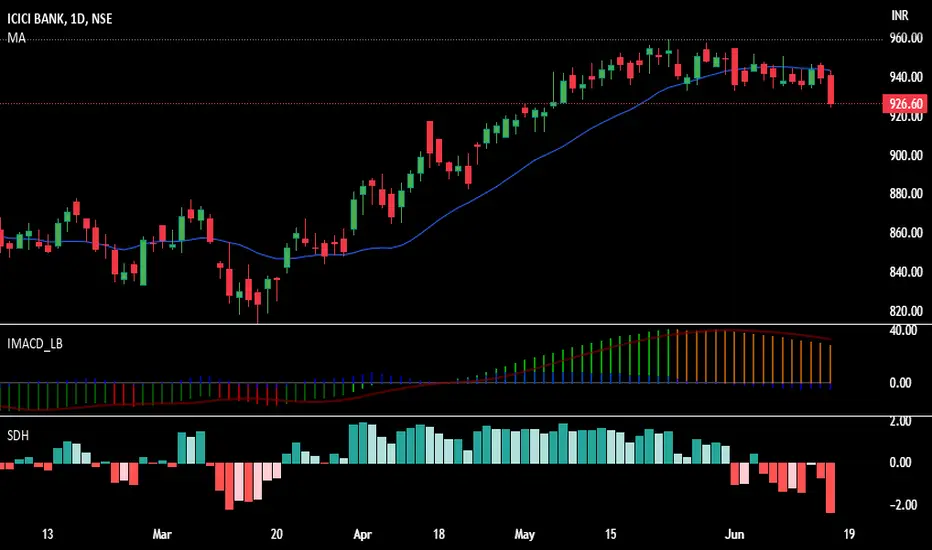
Profitable Trading Opportunity: ICICIBANK's Bearish MomentumTraders and investors looking for a lucrative opportunity in the stock market should closely monitor ICICIBANK for potential short positions. The stock recently closed below its 20-day Simple Moving Average (SMA), indicating a shift in sentiment towards bearishness. If ICICIBANK slips below the crucial support level of 924 tomorrow, it presents a favorable entry point for shorting the stock. With downside targets of 912 and 903, these profit targets can potentially be achieved within a single intraday session or over a period of 2 to 3 days. Don't miss out on this promising trading opportunity to capitalize on ICICIBANK's downward movement. Stay alert and execute your strategy wisely!
NZDCHF - Continuation To The Downside!Analysis:
This setup to us is ideal. Firstly price is clearly in a downwards trend and there is no doubt about this. We've seen price create a series of lower lows and lower highs which confirms that we are in a downwards trend. Knowing this we are only looking for shorts on this pair. Where price is currently is a very interesting area to us. Why? This area has held as major support in the past and as support recently so we now expect that it will hold as resistance. If you've been trading long enough you'll know that very often support can turn to resistance and resistance can turn into support. For more confluence at this area we have the 50% fib retracement level which we expect sellers will be sat at waiting before pushing price down further. We've also got an downwards trendline which has been beautifully respected multiple time showing us the bullish pressure and momentum on this pair. Fundamentally as well we're pretty neutral. Both the NZD and the CHF have almost the same long to short ratio so there isn't any real bias here until we dig a little further and we can see that the NZD only really had an increase in short positions by institutions whereas the CHF has an increase in both long and short positions by institutions so we actually have a slight bias to the bullish side of the CHF which goes with our idea and wraps up why we are bearish on this pair.
Please feel free to leave any comments you have and like this idea if you agree with us. Any feedback or comments will be read. We appreciate it all.
Stay Safe - JPI
Disclaimer:
This does not constitute as financial advise. We are not responsible for any monetary loss that you endure. Trading is hard to be profitable with and we take losses just like everyone else does to. Our ideas won't always be correct which is why we urge you to always do your own analysis first before entering into the market but please feel free to use our analysis to assist you with yours.

NZDCAD - descending channelThe price is moving in a descending channel and has reached the top of the channel and a strong horizontal resistance. From there, it is expected to move towards lower support levels.
1W:
1D:
Good trading!
If you find it useful, like, follow, share!

EURGBP: Descending triangleThe price broke a significant trendline and formed a descending triangle from which it is expected to move further downwards, targeting lower support levels.
Good trading!
If you find it useful, like, follow, share!

AUDCAD, headed for resistanceAUDCAD is approaching a resistance zone of around 0.908.
we will be looking for a sell confirmation within this zone.
check out the chart for the setup.


Punjab and Sindh Bank looking for good moveNSE:PSB seems good for a positional trade with provided entry, exit and stop level. It looks like has ended down tend on daily basis and has started new up trend on daily basis. Formed a good support level. On weekly scale it has already crossed 50 WMA over 200 WMA, that gives strength for the stock. Let's see what happens next.
Disclaimer:
My ideas are not for recommendation purpose. I am just sharing my ideas to share with community.

IOTEX short setup Hello Traders, here is the full analysis for this pair, let me know in the comment section below if you have any questions, the entry will be taken only if all rules of the strategies will be satisfied. I suggest you keep this pair on your watchlist and see if the rules of your strategy are satisfied. Please also refer to the Important Risk Notice linked below.

XPDUSD - Palladium Surplus?Analysis:
When we take a look at the technicals we can see that price is in a downwards trend. We're seeing lows get broken showing us the bearish momentum. Price has recently broken below a key level of previous support which we now expect will hold as resistance. We don't really have any other added confluences to this setup like a trendline or fib retracement levels which is why this isn't one of our favourite setups but still one that we are looking at. To add more clarity to this setup we need to look at the fundamentals. The USD is very strong at the moment and each week we see the USD getting stronger so this isn't something that we want to be going against. One of the main uses of palladium is for catalytic converters in car exhaust systems but with EV cars taking over the market we're starting to see less demand for palladium and it seems like there could be a surplus of palladium which would push price down further. With all of the confluences factors that we have we see price continuing its downwards trend that it is in.
Please feel free to leave any comments you have and like this idea if you agree with us. Any feedback or comments will be read. We appreciate it all.
Stay Safe - JPI
Disclaimer:
This does not constitute as financial advise. We are not responsible for any monetary loss that you endure. Trading is hard to be profitable with and we take losses just like everyone else does to. Our ideas won't always be correct which is why we urge you to always do your own analysis first before entering into the market but please feel free to use our analysis to assist you with yours.

Hindustan Aeronautical LTD: 12.7% Decline Brace for ImpactRun Now!!
In the upcoming bulletin, we're likely to hear some not-so-good news about Hindustan Aeronautics Ltd. So, it's better to run for cover!
Want a detailed analysis video? Drop a comment below!

Rsi Divergence in "Indhotel"Indian Hotel Stock did give a breakout
but didn't test the breakout levels and went up.
Today in Daily timeframe Stock Made a Bearish Engulfing Candle stick Pattern
Plus there is
Rsi Divergence in Indhotel Chart in Daily time frame so this stock is heading towards 349 levels.

USDJPY | SELL | Weakness DXYMRZ =multiple retest zone.
-After News 2030 hrs, USD weaken = DXY continue bearish sentiment.
-price unable to make new high, this further strengthen my bearish bias on UJ.
-i predict price may break lower trendline, opportunity to add more position.
trade idea:
-risk 1R ; TP Open.
Entry: 139.500 , SL 20pips
Trade management:
1. Price break LL, add position, risk : 1R
2. Price reject/retest LL, wait till bearish CS formed before enter. Conditions, CS must formed during active sessions , London/New York Sessions.

short position in FTMUSDT,4HIn FANTOM,we expect another drop to the trading range of the daily range.
We can open the short position with two entry price.

Short signal on RNDROpen short ONLY IF price is stabilized under 2.26; Entry: 2.25 SL: 2.40 TP: 2.06, 1.81

XCUUSD - Copper Demands On The Decline?Analysis:
Looking at the technicals on Copper we can see a clear downwards trend. Price is forming lower lows and lower highs which confirms that we are in a downwards trend. Price has also been respecting a downwards trendline which again shows us that we are in a downwards trend. We're currently sat at an area that we're interested in as price has held this area multiple times in the past so we expect that it will again. To give us more confidence with this setup, at our area we also have the 50% fib retracement level which we suspect bears will be wanting to hold and push price to the downside which favours our idea. We've also got the downwards trendline close by which if price reaches we'd expect to hold and to further help push price to the downside as bears will be waiting at this area. Fundamentally the USD is gaining a lot of strength in recent times and it continues to, until we see this change we are bullish on the USD, so this goes with our idea. Copper demands have decreased recently meaning that Copper prices will decrease. Comparing the decreasing demand for Copper against the strengthening USD it's clear to see that we want to be shorting this pair which is why we have a short bias.
Please feel free to leave any comments you have and like this idea if you agree with us. Any feedback or comments will be read. We appreciate it all.
Stay Safe - JPI
Disclaimer:
This does not constitute as financial advise. We are not responsible for any monetary loss that you endure. Trading is hard to be profitable with and we take losses just like everyone else does to. Our ideas won't always be correct which is why we urge you to always do your own analysis first before entering into the market but please feel free to use our analysis to assist you with yours.

AUDCAD - CAD Strength On The Horizon?Analysis:
Price has been in this downwards trend for a while now and we're expecting this to continue. Price has been forming a series of lower highs and lower lows which confirms our thesis that price is trending to the downside. Recently we saw price break below a key level of support and we're now seeing that same level get retested for resistance and we suspect that it will hold, as support can quite often become resistance and this level has held as resistance in the past before. To add to our idea we've also got the 50% fib retracement level at our area which we expect bears will be sat at wanting to push price to the downside which works with our idea. We've also got a downwards trendline which again we expect sellers will be waiting at, holding and pushing price down further. When we look at the fundamentals the AUD and CAD are both very similar in strength and weakness so there isn't any real bias here however we do still favour the CAD over the AUD as more institutions are exiting out of their short positions on the CAD and are in fact going long instead where as for the AUD we're seeing an increase in both long and short positions by institutions. Another factor why we prefer the CAD over the AUD is the the CAD is heavily related the oil prices. With Canada being the 4th largest oil exporter in the work and with the possibility of oil prices being on the rise again we could see the CAD start to gain some more strength. The AUD did have some positive news that came out yesterday however we don't see this bullishness continuing, especially after the AUD news release later on tonight which we expect will be bearish for the AUD. With all of the confluences factors that we have we get a short bias on this pair at this level so this is a pair that we are interested in.
Please feel free to leave any comments you have and like this idea if you agree with us. Any feedback or comments will be read. We appreciate it all.
Stay Safe - JPI
Disclaimer:
This does not constitute as financial advise. We are not responsible for any monetary loss that you endure. Trading is hard to be profitable with and we take losses just like everyone else does to. Our ideas won't always be correct which is why we urge you to always do your own analysis first before entering into the market but please feel free to use our analysis to assist you with yours.
