Gold📌 **Sell:**
✔ In short-term timeframes (M1, M5, M15), both MACD and Stochastic indicate overbought conditions and a potential downward correction.
✔ The M30 timeframe is still in an uptrend, but a pullback to the downside is possible.
🎯 **Conclusion:**
Success rate for selling: ✅ **70%** (more reliable than buying in the short term).
📌 **Strategy:** Short-term selling with a tight stop-loss and a corrective target towards lower support levels.
📌 **Buy:**
✔ In H1 and H4 timeframes, signs of a trend reversal are emerging, but MACD has not yet given a solid confirmation.
✔ If MACD turns bullish on H1 and Stochastic exits oversold territory, buying will be a safer option.
🎯 **Conclusion:**
Success rate for buying: ✅ **55%** (higher risk, requiring more confirmation).
📌 **Strategy:** Wait for MACD confirmation on H1, then enter a buy position upon resistance breakout.
🚀 **Final Recommendation:**
🔹 Enter short-term sell positions in lower timeframes with a tight stop-loss and proper risk management.
🔹 Wait for a confirmed buy signal on H1 and H4, as MACD has not yet turned fully bullish.
🚀 **Short-term selling (scalping) is more probable**, but additional confirmation is needed for a buy position.
### **Suggested Targets Based on Timeframes & MACD + Stochastic Analysis**
🔴 📉 **Sell Targets:**
Considering overbought conditions in lower timeframes and a potential downward correction, the best sell targets based on different timeframes are:
✅ 📌 **First Target:** 2850 (Short-term support in M5 & M15)
✅ 📌 **Second Target:** 2842 (Key support in M30)
✅ 📌 **Third Target:** 2830 - 2825 (Strong support in H1, aligning with the moving average)
🛑 **Stop Loss for Sell Positions:**
🔹 **2862** (Breakout of the current resistance in M15 & M30)
🔹 **2868** (If the price reaches this level, the trend may reverse)
---
🟢 📈 **Buy Targets:**
A **full confirmation from MACD in H1 and H4** is required for a buy setup. However, if the price rebounds from the **2830 support zone**, the following targets are expected:
✅ 📌 **First Target:** 2865 (Initial resistance in H1)
✅ 📌 **Second Target:** 2880 - 2890 (Strong resistance zone in H4)
✅ 📌 **Third Target:** 2915 (Long-term target if resistance levels are broken)
🛑 **Stop Loss for Buy Positions:**
🔹 **2825** (If this level is broken, the downtrend is likely to continue)
🚀 **Suggested Strategy:**
📌 **Short-term sell (scalping) from 2857**, targeting **2850 and 2842**, with a **stop loss at 2862**.
📌 **Buy if confirmed at 2830 - 2825**, targeting **2865 and 2880**, with a **stop loss at 2825**.
🔍 **Important:** Before entering positions, confirm with **trading volume and candlestick patterns in higher timeframes**. 🚀
Shot

bluzelle (BLZ)bluzelle not doing so hot as of right now. In the past bluzelle was focused on gaming. Now the company is focused on DeSci, decentralized science and in particular a focus on aging or rather de-aging. There used to be a picture of Tesla on their page, now there are pictures of other people, less recognizable people to the naked eye, or unfamiliar to those within the inner circle of important people in history. Bluzelle is now involved in crowdfunding, and as we all know, funding is a tough business that usually fails to persist along with other more equitable projects. Academics and making money do not usually mix. Academics spends more money than they make.

CADJPYHere is our view on CADJPY . Potential short opportunity.
CADJPY has been following the downtrend for quite some time now. After its pullback to 107.100 the H4 is turning bearish again. After considering this we might continue following the trend and target lower levels such as 105.400 and 104.780 where our TP (Take Profit) is sitting at. If we break above our SL (Stop Loss) sitting at 107.485 we might visit higher prices. Our entry is at market price (current) sitting at 106.665 .
PARAMETERS
- Entry: 106.665
- SL: 107.485
- TP: 104.780
KEY NOTES
- CADJPY is in a downtrend.
- CADJPY has made its pullback to 107.100.
- Breaks above our SL (Stop Loss) would result in higher prices and possible reverses.
Happy trading!
FxPocket

BTC - a last dip before new ATH ?The chart is in 3H cause couldn't zoom out more with lower timeframes :((
Pattern recognition at its best
since the low of the 10 October, the price action is an extremely exact copy paste of march/April ATH :
- A significant top, ATH for the first pattern and 3 months high for last week
- first take profits, to 200MA 4H for the first pattern, to 100 MA 4H, 4 days ago
- 2nd wave and 3rd wave higher than the second (almost hit ATH), the second wave has been made and BTC will probably make the third tomorrow
in April this followed a correction. The pattern was bigger in April in % price and in time, so we should see shorter waves and lower price movements now.
The conditions for this to continue as the last time and to see the last dip is to have a 3rd wave going around 69K :
- if we break above 69k the pattern get invalidated
- if we stay to long time above .618 fib extension at 66K3 the pattern get invalidated
_________
Careful don't mind me, I'm neutral on this idea, and will not do anything before seeing a clear path. What changes now from April is that the halving was priced in way before so I'm seeing also lot of reasons why prices could just go above 69k and fly from now
_________
Last but not least, BTC is for the moment following the orange path from my precedent idea, putting my target for fall 2025 at 240K, but this can change a lot
Good Luck
Cheers

sol story telling shotbullish on sol
story telling
bullish mumentum in background
reversal and bullish secret counts lead pump party

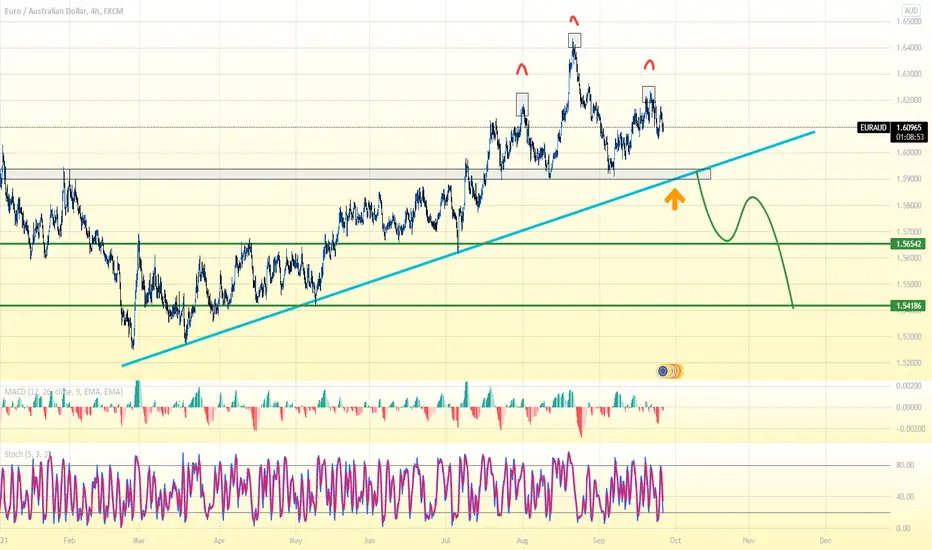
EURAUD: Bears Will Push Lower
The price of EURAUD will most likely collapse soon enough, due to the supply beginning to exceed demand which we can see by looking at the chart of the pair.
❤️ Please, support our work with like & comment! ❤️

AUDJPY shortI'm thinking short-term, many markets are closed, but this could be good for today! However, let's be cautious because a sudden spike could come at any moment! We are still within the daily range! GO FOR IT!

SHOTSeems like another counter waiting for a big move. Do note the massive volume spike.
DMAS have convergence. 9.7 will be an important price point for bulls to flip.!


APT SHOT SIGNALS RBI!!!!Hi, friends. Nice to meet you.
This flatline is showing a decline.
We are getting off at a critical juncture.
TP can be divided into three categories.

✅EUR_GBP RISKY SHORT🔥
✅EUR_GBP price went up sharply
But a strong resistance level was hit
Thus, as a pullback is already happening
And a move down towards the target shall follow
SHORT🔥
✅Like and subscribe to never miss a new idea!✅


✅GOLD HOW TO TRADE? |SHORT🔥
✅GOLD s trading in a downtrend
And the price has make a pullback
From the falling resistance
Now, it is retesting a key level
So IF we see a breakout to the
Downside, then Gold will go down
IF the price breaks the falling resistance then the setup is invalid
But for now the bearish scenario
Seems to be more probable
SHORT🔥
✅Like and subscribe to never miss a new idea!✅

MRNAHead and shoulders on Moderna stock. Biden over the weekend stated the pandemic is over based off headline news.. Just a matter of time until the stock is worth about 40-70$.. been waiting on this.
This company was worth decimals before the pandemic lol.

shortreally bad news for gold!! really sad.. so i am expecting 1700-1600 for gold, hedge against inflation , i dont think so!!!

USDJPY Trading IdeaSo if you missed the first entry which is too risky and I understand why you probably shouldn't
and that is fine. Do not chase it down but wait for it and a small ABC (abc if you are an Elliott gal.
Wait for this move in green which should look like an abc and place a sell order in the red circle area.
Of course this is only a hypothesis so we can't be certain when this move (pattern) will happen or
what price range, this is just to help you understand how to cultivate patience, and create a trading
plan and not "chase" the trade. By the way, pretty good analysis huh?

DXY BIG SELL BREAKDOWN This is my anticipation on Dollar Index for upcoming weeks. Currently, sub-wave C of wave 4 just kicked off. It contains 3 waves i.e. corrective wave ABC waves as we can see on the chart above. Let’s see how the market will play out as inflation keeps on decreasing.
To enter, wait for channel break followed by a bear flag, then it’s safer to enter the market. Fibonacci retracements can be of a better use if price rejects your fibs level with other confluences such as 21 ema cross, etc. Good luck traders and have a blessed week.

GBPAUD SELLShort Gbpaud - Techincal trade. Off price action
Fibs and yellow zones indicates TP not s/r levels
Short term Trade
Bearish candle emerging the bullish movement which indicated the trend
comment bellow what you think of the trade movements .


DOGE TO THE MOONGreat time to dip into Doge looking like a triple ripple. Double Down now rake it in later. Looks a little funny don`t it. Ha Ha go for the triple play. REQ is still the hottest thing going.

eth/usd steps the same and will not change much for nowstill tied to btc but for how much longer stay tuned and check back to see how things turn out c u on the flip side

VRAUSDT SHORTThe Head and Shoulders pattern is one of the oldest recognised market structures. Representing a fully formed fractal when completed, the H&S confirms a short term reversal in trend.

EURAUD head and shoulderEUR/AUD head and shoulder pattern
Please wait for the price to break the neckline